Look: I am eager to learn stuff I don't know--which requires actively courting and posting smart disagreement.

But as you will understand, I don't like to post things that mischaracterize and are aimed to mislead.

-- Brad Delong

Copyright Notice

Everything that appears on this blog is the copyrighted property of somebody. Often, but not always, that somebody is me. For things that are not mine, I either have obtained permission, or claim fair use. Feel free to quote me, but attribute, please. My photos and poetry are dear to my heart, and may not be used without permission. Ditto, my other intellectual property, such as charts and graphs. I'm probably willing to share. Let's talk. Violators will be damned for all eternity to the circle of hell populated by Rosanne Barr, Mrs Miller [look her up], and trombonists who are unable play in tune. You cannot possibly imagine the agony. If you have a question, email me: jazzbumpa@gmail.com. I'll answer when I feel like it. Cheers!

Saturday, December 31, 2011

Farming

Marginally arable land, rural golf courses, and millions of acres in the federal Conservation Reserve Program are being farmed.  Farmers are tearing down fences and structures and uprooting trees,  to be able to get in a few more rows of planting.  This is immediate dangerous to land and water, and unsustainable over time.    Read about it here.

The force pushing more land into production is the rise in crop prices: in the past five years corn prices tripled and those for soybeans doubled because of swelling worldwide demand, including demand for ethanol production. At the same time yields have spiked because of genetically engineered crops and improvements in farming technology, which are also allowing farmers to grow in previously inhospitable areas.

I just read somewhere yesterday that 60% of the corn grown in the U.S. is a recently developed hybrid that is toxic to corn root worm.  The high use rate is due to the resistance this hybrid offers, without requiring the use of pesticides.  This is part of the reason for the high yields mentioned in the quote above.  The downside is that the root worm - quite predictably - is developing resistance, and re-invading the corn fields. I can't find where I read about it, but you can read about it here.

Maybe my reptile brain is taking over and I'm getting needlessly alarmist.  But I'm connecting these dots with a global warming dot. Unsustainable farming practices, failure of pest-resistant hybrids, and a changing global temperature pattern could combine to cause some sort of massive systemic failure.

What chance do you see for a major world-wide food crisis in 5, 10, or 20 years?

I think the chances are quite good that the outcome will be really bad.


Friday, December 30, 2011

Predictions

Mish has predictions for 2012.

Some look good, and others look absurd.  (Paul beats Obama?)   Maybe I'll comment on them.  Then again, maybe not.  But I do want to keep the link.


Delong Tip-toes Around the Rentier Issue

Via Thoma I see an article by Brad Delong that I would otherwise have missed.

Brad tells us that, "In 1950. finance and insurance in the United States accounted for 2.8% of GDP  . . .  Today, it is 8.4% of GDP, and it is not shrinking."

That is exactly a 3-fold increase, and correlates pretty well (as far as those two numbers take us) with the growth of the finance sector share of total corporate profits.  Brad references Justin Lahart of the WSJ, who opines that this has “not, by and large, been a bad thing....Deploying capital to the places where it can be best used helps the economy grow...

Which would be true, except that it's not.  The finance sector share of profits has not been in a steady year-over-year increase.  Instead, as can be seen in the chart at my link above, it oscillated around an exponentially increasing trend line, with sequentially higher highs, and higher lows.  Notably, with only one exception (1986) every peak in finance sector grab lines up with a recession, all the way back to the start of the data set in 1947.  Given these facts, the notion that capital is being best deployed looks a lot like a god-damned lie.

Brad is more polite - and more numerical:

But if the US were getting good value from the extra 5.6% of GDP that it is now spending on finance and insurance – the extra $750 billion diverted annually from paying people who make directly useful goods and provide directly useful services – it would be obvious in the statistics. At a typical 5% annual real interest rate for risky cash flows, diverting that large a share of resources away from goods and services directly useful this year is a good bargain only if it boosts overall annual economic growth by 0.3% – or 6% per 25-year generation.

Besides which:

Finally, better finance should mean better corporate governance. Since shareholder democracy does not provide effective control over entrenched, runaway, self-indulgent management, finance has a potentially powerful role to play in ensuring that corporate managers work in the interest of shareholders. 

How well do you think that is working?

Overall, however, it remains disturbing that we do not see the obvious large benefits, at either the micro or macro level, in the US economy’s efficiency that would justify spending an extra 5.6% of GDP every year on finance and insurance. Lahart cites the conclusion of New York University’s Thomas Philippon that today’s US financial sector is outsized by two percentage points of GDP. And it is very possible that Philippon’s estimate of the size of the US financial sector’s hypertrophy is too small.

At this point Brad could have said something about the rentier activities of finance sucking the life blood from American capitalism.    But we get nothing - even a single subordinate clause - on that topic.

Despite this missed opportunity, the article is well worth reading.  Go check it out.

Say's Law and Ricardian Equivalence

I'll admit I get a bit confused thinking about Say's Law and Ricardian Equivalence - which I never do, unless actually reading about them somewhere.  But the kerfuffle between Krugman and Lucas has been pretty hard to ignore.  (Each of them is confused as well - or not - depending on whom you chose to believe.)  You can read about it in many places.

What Lucas said.

What Krugman said.

Econospeak

Macromania

Noahpinion

At Noah's place I launched into a reality based critique of Say's Law.  Though it turns out not to have been quite Say's Law, after all.  Like I said, this kind of B.S confuses me.  Still, I think I've given a valid criticism of some aspect of conservative economic thought. 

you can't get around Say's Law by taxing people in the future instead of today, because people are forward-looking and have rational expectations

If Say's Law were not invalidated for other reasons, it would absolutely fall apart here.

Have you ever heard anybody ponder what they would be doing with their money 5 or 10 years down the road if they didn't buy a big screen TV today?

Does anyone ponder relative poverty in their old age vs taking a vacation now?

To the extent that most people think about money at all, it's implicitly in terms of cash flow. Can I make the finance payments on this purchase and still afford to feed my cat? This is the real wold, which is apparently terra incognita to economists.

Plus, rational expectations is the silliest idea to be taken seriously since chemists gave up on phlogiston. People act from the cerebral cortex at least as often as they act from the neocortex. This gives us wars and the herding instinct, makes bubbles and Ponzi schemes so exciting, and enables all sorts of wildly irrational behavior, like voting for Republicans or believing in Ricardian equivalence.

Hale "Bonddad" Stewart also weighs in a Noah's place, with a link to a post where he dismembers Ricardian equivalence with empirical data.  My kind of guy.

UpdateBrad Delong chides Noah, and in the process of clarification, confuses me further.

Wednesday, December 28, 2011

Holy Coleoidea!

I had a beautiful cephalopodian Bumpa-grandduaghter moment on Christmas (aka Cephalo-Festivus*) eve.  Nine-year-old Samantha had requested a fish from Santa Claus.  Her mom was adamant that no such fish would be forth-coming.  (As an aside, it was revealed that Santa will only deliver animals of any kind with prior parental approval.)  Sam was equally adamant the she was going to get her fish, and went around singing "I Want A Fish For Christmas," providing her own original lyrics to this tune.

Big sister Amanda (age 14) piped in, saying, "How could Santa deliver a fish?"  Evidently, his sleigh is not properly equipped for transporting them. 

"Well", I suggested, "think about how Santa gets from Scotland to Nova Scotia."

"He crosses the sea," Amanda replied, warily.

It was then generally - albeit reluctantly - agreed that he could at any random moment just swoop down and scoop a fish out from the drink.  "Actually," I said, "I was thinking more of a squid."

The look of disdain on Samantha's face was worth the price of admission, all by itself.

Pressing on, I asked, "If you got a squid, what would you name it?"

After a moments thought, Sam replied, "Squidward."   I thought that was quite good; but her dad interjected, "What about Squidney?"

On that cue, I started riffing about the squid's long, flexible tentacles.  Middle sister Rebekka (age 11) was sitting next to me on the couch, and from the corner of my eye, I saw the light bulb go on over her head.  We looked at each other and said, in perfect unison: "Squid don't have any knees."  The infamous Bumba-Bekka mind meld was in full force.

Then we high-fived amidst the groans.   It was fabulous.

After all that quieted down, I told Sam to call me on Christmas morning (but not too early) and tell me if she got her fish.  (In my exalted position of bumpahood, I had some inside information.)

When the call came she was one excited little girl.  Santa brought her an aquarium, and all the required accessories, along with a gift card to a pet shop, where she could choose her own fish.

That Santa - what a guy!
______________________________
* Find the explanation in comments here.

Tuesday, December 27, 2011

Six Reasons . . . Ron Paul

Mish gives us six reasons to vote for Ron Paul.  I am not making this up.

  1. Paul is the only one for a balanced budget and a plan to get there
  2. the only one who would bring US troops home immediately
  3. the only one who would end the Fed
  4. the only one who believes in the free market
  5. the only one who believes gold should be money
  6. the only one who would dismantle entire government departments

I see five good reasons NOT to vote for Ron Paul.  In general, his thinking is about as nuanced as a sledge hammer - which is no more than what you can expect from a sociopath.  Regarding item 2, Paul is only against war because it is an example of government spending.  So, on the one thing he gets right, it's for the wrong reason.

What I will say for Paul is that (although he is every bit as capable of mendacity as any other politician) I do not doubt his sincerity and openness regarding his policy positions.  What you see is really what you will get.

Unfortunately, what you see is somewhere between butt-ignorant and bat-shit crazy.


More Fun with FRED

FRED:


I stumbled across data series AHETPI,  Average Hourly Earnings of Production and Nonsupervisory Employees, starting in 1964.


If this has anything like the usual quasi-exponential curve shape one expects with time series data, it is with an awfully small exponent.  Of course, on some scale, a curve segment can look like a straight(ish) line, but that just reinforces the point.

Here it is on a log scale.


Clearly, there are two regimes with starkly different growth rates.  The break point, of course is in the early 80's.

For perspective, I plotted this curve along with series A576RC1, that we examined yesterday.  That series is total salary and wage disbursements for the population, while this one is certain employees per hour, so I used A576RC1 per capita.  Then, to get them on a comparable scale, I divided AHETPI by 1000.  After all that, the ordinate values don't mean anything; it's the shapes of the curves that we're comparing.


This is similar to the mean vs median income data we've looked at before, and shouldn't be a surprise.  

Let's look at how AHETPI has been affected by inflation.


Wow!  Somebody could write a book about this chart, and maybe somebody should.  For now, I'll just make a few observations.

For wage earners, the post WW II golden age really was golden, as real hourly earnings increased dramatically, peaking in 1973.

Then, except for a slight recovery after the '74 recession, it was downhill for 2 decades. 

The steepest slide came during the late 70's, when inflation was high, and wage and price controls capped earnings increases.

Even after inflation was conquered, real wages continued to slide through the mid 90's.

The mini golden age of Clinton's second term looks pretty darn good.

Since then, it's been basically flat, except for an unexpected jump up during the great recession.

I'm trying to rationalize the jump up.  Two things I can think of that might be operating are a) the selective elimination of lower paying jobs, and b) temporary deflation during the crisis.  I'd welcome critical evaluation of these ideas, and any other suggestions to help understand this.

Update:

There was a brief dive into deflation during the financial melt-down.


Update 2:  Meanwhile, see what Art has been up to.

Monday, December 26, 2011

The Republican Brain

The Republican Brain is characterized as follows.

This brain controls body functions required for sustaining life, such as heart rate, breathing, balance and body temperature.

It is reliable, but tends to be cold, rigid and compulsive.

Behaviour relating to survival of the species, such as sexual behaviour, is instinctive and responses are automatic.

One of these instinctive reactions is to handle survival via the flight or fight response.

It is responsible for species-typical instinctual behaviors involved in aggression, dominance, territoriality, and ritual displays. 

It is hierarchical, obsessive, authoritarian and aggressive, with paranoid tendencies.

When acting from these instincts, action is informed by neither though nor feeling.

Territory is acquired by force and defended. Might is right.

It does not learn from mistakes.

This, of course, is a description of the functions of the cerebral cortex, also known as the reptile brain.  This is the most primitive region of the human brain.  As evolution progressed, the limbic region, common to all mammals, was added. It enables learning, emotion, and the ability to make value judgments.  Higher on the evolutionary scale, primates, including humans, have another added region, the cerebral  neocortex.  It enables language, abstract thought, imagination and consciousness.

It is not that Rethugs are totally devoid of limbic and  neocortex functions; they are, after all, more or less human.  Rather, it is the utter dominance of the cerebral cortex over the other two brain segments - in situations that matter the most - that impels me to refer to them as LIZARD PEOPLE.

And I do this based simply on empirical observation, without in any way invoking ancient Sumerian mythology, weird conspiracy theories, or, most emphatically, any combination of the two.


This post was inspired by my comment at Johnathon Bernstein's Blog, and results from a total inability this day to do anything even remotely constructive.

UPDATE:  Thanks to Couves, commenting before and after me at Bernstein's, we learn that Donald Rumsfeld had a point-blank opportunity under direct questioning to deny that he is a lizard, and he wouldn't do it.  This is around the 3 minute mark at the link.  Make of it what you will.  Of course, my mind was made up before I received this new gem of knowledge.

References:

Reptilian vs Mamillian Brain

THE EVOLUTIONARY LAYERS OF THE HUMAN BRAIN

Jesus So Loved the Rich

I'm not a religious man, but occasionally I'll attend church service with family members who are considerably less heathen than I.  So it went on Christmas Eve, when the Lutheran pastor made rather a big deal about the baby Jesus.  Well, why not?  Tradition has it that this is his birthday, belief has it that he was God made flesh, and the whole salvation story revolves around this event.

And the circumstances into which Jesus was born are more than just detail and literary setting.  To a large extent, the entire Christian ethic builds on a foundation of the specifics of the birth of Jesus.

That's why it is really import to remember that Jesus, of the royal house of David, was born in the palace of Herod, amidst the wealth, pomp and splendor that befits one of his station.  His mother was surrounded by ladies in waiting.  His father was feasted by the royalty in attendance.  The new-born baby was exulted above all, and celebrated by the population as they welcomed the dawn of a new era.

So that this early message would not be lost, Jesus reinforced the idea of God bestowing his favor on the rich and powerful by all the actions of his adult public life.  These events stand out in particular.

Driving the beggars away from the Temple so that they would not annoy the money-changers, whom Jesus loved above all.

Healing the sick - but only among the elite, who alone were able to afford -or, to be sure, were even worthy of - his ministrations.

Traveling in splendor throughout the countryside, demanding homage from the poor, downtrodden and dispossessed, while seeking the company of and giving wise council and precious gifts to wealthy merchants and powerful politicians.

Demanding compensation in the form of loaves and fishes from the poor, unwashed masses who wished to hear him preach on a mountainside.

Matching word to deed, Jesus frequently reminded us that salvation is for those blessed with money and power, and thus able to buy their way into eternal paradise.  Most telling was his statement that it was easier for a camel to pass through the eye of the needle than for a poor person to get into heaven.

Thus has it ever been: the meek are downtrodden, while the rich inherit the earth.  Who can doubt the wisdom Jesus displayed in his choices of business partners, companions, and life style.

On the other hand, though, I guess it also explains why the common people demanded his death.  Why his rich friends allowed it to happen remains one of the great mysteries of faith.

Wandering with FRED - Wages

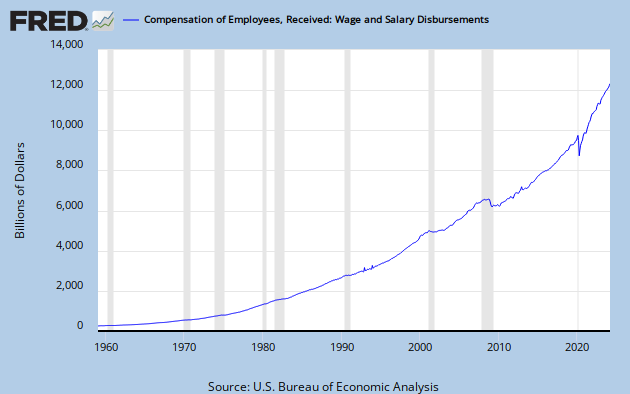
Wandering through the FRED databases this morning, I took a look at series A576RC1, Salary and Wage Disbursements, which starts in 1959.  This journey was prompted by comments to this post by Noah.


Observations:
1) The same quasi-exponential curve shape one sees in lots of economic time series data.  This is simply more-or-less regular growth.  The interesting stories are in the irregularities.
2) Noticeable flat spots during recessions.
3) Effects of recessions seem to be getting greater with the passage of time: longer flats, lingering loss of slope; i.e. increasingly anemic recoveries, as measured by compensation.
4) The recent great recession has been particularly dire in its effects.

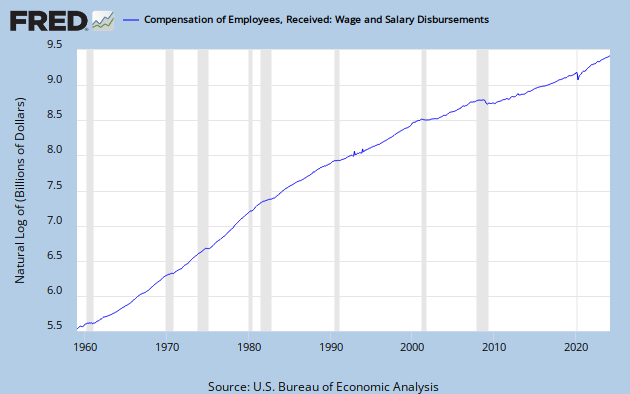
 With this kind of data series, it's often helpful to look at it on a log scale.  Remember, on a log scale, an upward sloping straight line indicates a constant rate of growth, with the steepness of the line determined by the growth rate.


Observations:
1) The line breaks in the early 80's, around 2000, and again in the Great Recession of 2008.
2) Each of these leads to slower growth in total worker compensation.
3) The current slope is extremely gentle, though that word feels distinctly oxymoronic in context.  This is close to zero growth.

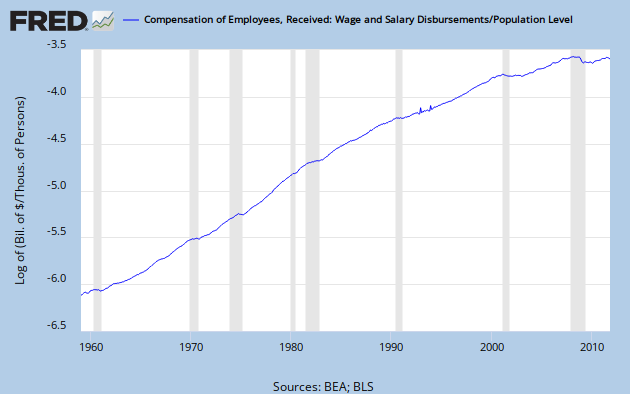
We're looking at total wage and salary outlays.  FRED allows all sorts of data manipulations, so lets look at it per capita.  For this I divided by FRED series CNP160V, Civilian Non-institutional Population. I also adjusted the time scale, starting at 1955 instead of 1950 to get rid of some wasted left side space.


Observation:
Adjusting for population growth doesn't change the shape of the curve in any substantial way, probably because population growth has been relatively constant over the period.  Or, perhaps, there is something subtle that I am missing.

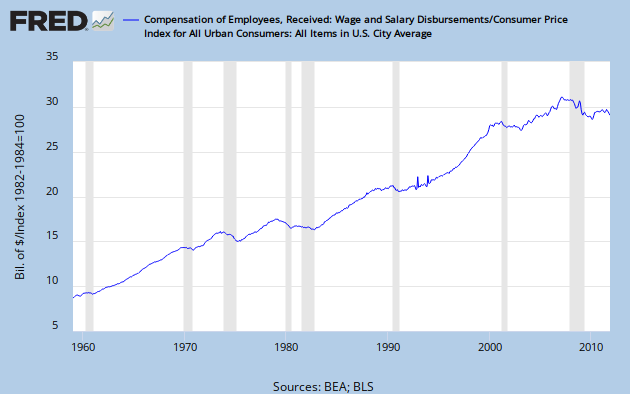
Here is how it looks adjusting for inflation, FRED series CPICAUSL.


Observations:
1) This is a lot more interesting: big loses in recessions, slow growth overall during the stagflationary 70's.
2) Anemic recovery from the Great Recession, actual flat line since.
3) Strong growth during the late 90's.

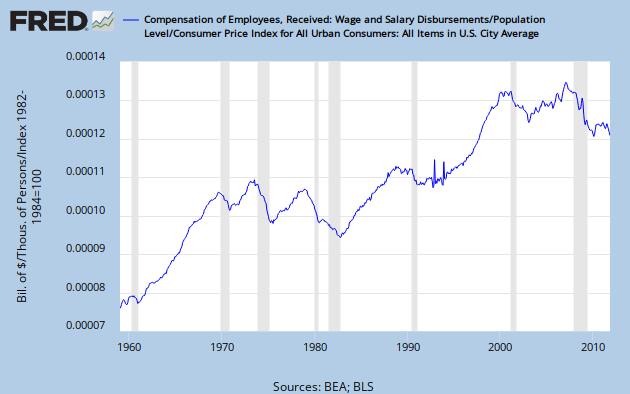
This makes me wonder how it looks per capita, inflation adjusted.


Observations:
1) Adjusting for both population growth and inflation is very revealing. Real Wages Per Capita  (RWPC) churned through the 70's with the result being a net loss.
2) Recovery through the 80's barely brought RWPC to a new high.
3) RWPC plateaued, then slumped.
4) Robust growth through the 90's led to a meaningful new high.
5) Steep declines in both of this century's recessions.
6) Despite a marginal new high just before the Great Recession, the clear trend this century has been down.

Meanwhile, income and wealth disparity has reached historically high levels, and corporations are raking in record profits.

Remember, these numbers are total compensation, so they include whatever is being made by CEO's and rentiers in the finance sector.  Don't forget about the differences between mean and median income.

Looks like we've been getting screwed for decades.


Friday, December 23, 2011

Feelin' Grinchy

My arrangement of Mr. Grinch.

The Christmas Song

My arrangement of the Christmas Song by Mel Torme.

Merry Christmas.


What the Hell?!? Friday - Spin(?)

Spin -- Illusion or Reality  .  .  .   Does it matter?


Mark puts this optical oddity into a real world context.  Check it out at his place.


Thursday, December 22, 2011

GDP Revised Down

Here is the report from BEA.  Annualized, the growth rate for the 3rd quarter was revised down from 2.0% in the 2nd estimate to 1.8% in the third estimate.  Real GDP increased at a rae of 1.3% in the 2nd quarter.

This is significantly below the normal historical growth rate, and absolutely dismal in what is supposed to be a recovery.  It gets worse, though.  The population continues to grow irrespective of what the economy is doing.  The estimated population growth for CY 2011 is 0.963%.  That's a lot if implied precision for an estimate, but who knows, maybe they're just that good.

Consider GDP/capita - the average slice of the American economic pie.  That rate of growth is 1.018/1.00963 = 1.00832.  So - the growth rate of real GDP/cap is a lousy 0.832%.

Meanwhile, as national wealth per cap growth is less than a single digit, CEO salary increases are deep into double digit territory, with a median of 27% for U.S. companies in general, and a whopping 37% for companies in the S and P 500.   

"Wages for everybody else have either been in decline or stagnated in this period, and that's for those who are in work," Paul Hodgson, a senior research associate at GMI, told the Guardian. "I had a feeling that we would see some significant increases this year. But 30 to 40 percent was something of a surprise."

John H. Hammergren of healthcare company McKesson Corp. was the highest-paid CEO in 2010, taking home $145.3 million in compensation, the LA Times reported. His base salary of $1.6 million was supplemented by more than 3.3 million exercised stock options, which earned him a profit of $112 million.

Three of the ten executives with the biggest pay packages were in the healthcare industry, while another two were in real estate, MoneyWatch reported. Four CEOs on the list retired or were let go last year, pumping up their pay with severance or stock sales on the way out, the LA Times reported.

Now that is interesting.  Healthcare is in crisis, but the CEO's rake tens of millions off the top while health care related expenses cause more than half of all personal bankruptcies.  CEO's get fabulously wealthy in real estate, while millions of people are under water in their mortgages.  Topping it off is the practice of rewarding failure with enormous monetary payouts.

Does anyone see a disconnect here?

Don't you think this might be a part of why we are so badly screwed?

Dancing From Aisle to Isle

My Filipino friend Patricio posted this on Facebook. 

MANILA, Philippines (AP) — Who says plane travel can't be fun?

Flight attendants for a low-cost Philippine airline who gained fame by dancing through safety demonstrations are back swaying through the aisles.

They've swapped the Lady Gaga tunes that made them popular last year for Mariah Carey's "All I Want for Christmas Is You."

Manila-based Cebu Pacific airline says the choreographed dance helps passengers pay more attention to the safety demonstration.

For sure.  Here is their routine from last year.


Chicago Fed Index Declines

Calculated Risk presents the November Chicago Fed data on their economic activity index.  "A zero value for the index indicates that the national economy is expanding at its historical trend rate of growth; negative values indicate below-average growth; and positive values indicate above-average growth."

The index dropped from -0.11 in October to -0.37 in November - a trivial change, but directionally unfavorable.  Last quarter GDP growth has also been revised down from 2.0 to 1.8%.  If this is recovery, it is very anemic.

Here is the CR graph of the data.  I noted almost two years ago that this index traces a line pretty similar to quarterly GDP growth.  The slopes are a bit different, and the trend lines aren't parallel, but general contours are similar, and the peak/valley timing lines up quite well.  Here is a graph of quarterly growth in real GDP that I posted in May.

So far, this has not been a good century, and there's little reason to believe it's going to get much better any time soon.

Fed Policy Failure As Root Cause

I decided long ago to not read Scott Sumner, but I'm not bigoted about it.  Karl Smith directs us to this post by Sumner, in which he does a clever personal riff on a Wittgenstin quote.

In the context of the great recession we are still enduring, Sumner uses this to blame the Fed.  He says this in comments to his post, at 14:13 on 16 Dec,. re: the Fed.

 They intervene every second of every day. They control monetary policy and hence NGDP. 

And this:

The crisis of 2008 was caused by tight money at the Fed. They deviated from their normal dual mandate in September 2008, and it was all downhill from there.

There is probably a good argument that the Fed was following tighter policy than they should have around that time - and quite possibly had been for a considerable while.  But the view that monetary policy is omnipotent seems awfully one-dimensional to me.  I cite the inability of QE money to spur the economy - it has mostly wound up in excess reserves. This view also implicitly dismisses the idea suggested about 20 minutes earlier by commentor Donald A Coffin, that capitalism has some level of inherent instability -- which Sumner simply shrugged off.

The idea that that the Fed is intervening during seconds, hours, days and weeks on end, when they make no policy decisions at all seems to be a reach too far.

The really striking thing, though, is the accusation that that the Fed made a policy turn in September, 2008.  Does anybody have a clue what they might suddenly have started doing differently?

Later in comments, flow5 says:

That’s not exactly what happened. Bernanke tightened MVt for 29 consecutive months. The Case Schiller housing index peaked @189.93 when Bernanke initiated his tight money policy. Based upon the FED’s technical criteria (interest rates), the 4th quarter contraction in 2008 was already “set in stone” beginning in Jan of that year. I.e., the Fed’s failure to prevent NGDP from falling started long before the economy collapsed.

In the midst of all this, what I find most puzzling is Sumner's insistence that a market in NGDP futures contracts will lead to stable levels of NGDP.  This is the highest order of dog wagging I have ever seen suggested to any tail.


Tuesday, December 20, 2011

How Important Is Hayek?

Art reminds us of one of Krugman's posts from a couple weeks ago, with this PK quote:

"David Warsh finally says what someone needed to say: Friedrich Hayek is not an important figure in the history of macroeconomics."

PK goes on to point out that Hayek's current relevance is almost purely political rather than economic, with the implication that it is a distorted view of Hayek that the current crop of right wingers uses to oppose anything that smacks of progressivism. Warsh, in the link above, is more blunt, or as PK puts it, "cruel."

To be clear, this bluntness and/or cruelty is not leveled at Hayek himself, but rather at those who would self-servingly re-animate him as a conservatard caricature.

Warsh: "But the claims conservatives are making about the role he played as an economist are beginning to smack of Ruizismus. That is, they have jumped a caricature out of the bushes late in the day and claim that their guy ran a great race."

Warsh took a lot of heat in comments - which he accepted with almost saintly forbearance - from right wingers who misread his post. These are not stupid people. Their misreading comes from ideological blindness - an insidious form of self-induced, willful ignorance.


My comment at Warsh's place, from earlier today:

I’m later than late to this post, and took the curious route of reading the comments first. That made the post itself quite a revelation. Having no dog in this fight, it’s pretty easy for me to see that it is far from the hatchet job that several other commenters imagine it to be.

It’s not clear whether the point is to damn Hayek with faint praise or to praise him with faint damnation. But there is some attempt at balance, and it is clear that accusations of ad hominem are rising from fevered imaginations. An unbiased reader will note that mention of Hayek’s divorce was in the context of “Thereafter he labored under five distinct handicaps,” which is actually giving him a bit of cover for decades of relative obscurity.

Re: the n-gram chart, (linked in comment 24 by Paul Wolfson) it’s easy for an objective observer to note that Hayek had gone absolutely nowhere for 30 years before his Nobel reception tickled a modicum of interest. Then Reagan/Thatcher supply-side-ism – however irrelevant – gave him a boost, for about a decade. Since then, even with Beck’s hucksterism, it been flat-line, at best, for well over a decade.

The decline of Keynes and Friedman over that same span may well reflect the general dumbing-down of practically everything in a sound-bite age dominated by professional liars like Gingrich, Limbaugh and Murdoch’s entire stable, and dim-wits like Paul Ryan, Michelle Bachman and Rick Perry.

Even in his grave, poor Keynes has been ad-hominem-ed to death. More so that any other currently dead economist. Well, except for Marx.

So – are we screwed, or what?


Saturday, December 17, 2011

Of Health Care and Insurance Redux

Just a year ago today I spelled out why for-profit health care insurance is an inferior model compared to single payer or socialized medicine.  Today, Krugman revisits the issue.  He links to yesterday's article by Ezra Klein, where Ezra naively says: "But the CBO is in the right here: No matter how much sense competition makes in theory, no matter how obvious it is that it will drive down the price of health care, the fact is that it keeps failing when we put it into practice."

Ezra totally misses the main point: competition makes no sense at all in theory, and can only drive costs up.  The failure in practice is the result that should have been expected by anyone who had devoted as much as 5 minutes objective thought to the issue.   He goes on to show specifically how it hasn't worked in the real world.

Krugman continues:

Why doesn’t the market work here? Ken Arrow explained it all half a century ago. Patients by and large don’t have the information to evaluate medical treatments; in any case, they mainly buy insurance rather than medical care directly; and insurers profit not by providing the most cost-effective care, but by trying to insure people who won’t need care.

The red highlighted section briefly summarizes part of my argument.  The Arrow link is to a 33 page PDF file.

Clearly, the brute economics of heath care refute models proposed by right wing ideologues.  There is another aspect to this, though - health care is not merely "a commercial transaction."   Decisions are literally life and death, frequently made under emotionally trying circumstances, the Dr. - patient knowledge disparity is wildly assymetric, and opportunities for over-care and conflict of interest abound.

As PK put it:

The idea that all this can be reduced to money — that doctors are just “providers” selling services to health care “consumers” — is, well, sickening. And the prevalence of this kind of language is a sign that something has gone very wrong not just with this discussion, but with our society’s values.

And for this wrongitude we can specifically and directly thank the lizard people.

Wednesday, December 14, 2011

Trend Line Failure and The Housing Bubble

Back in 2005, Very Serious People like Alan Greenspan were assuring us that there was no housing bubble.

" . . .  Although we certainly cannot rule out home price declines, especially in some local markets, these declines, were they to occur, likely would not have substantial macroeconomic implications. 

Well, hindsight is always 20/20, but one can make a very good case that housing prices up until just about the very moment of Greenspan's infamous prediction were bubblicious, indeed.

Here's the evidence*.


This graph shows year over year rate of change in home prices.  First, I'll suggest that a 12% YoY increase in anything, anywhere, any time is unsustainable.   Hence the late 80's - early 90's housing decline, which I have labeled a crash.  But that crash was not much - a brief excursion into negative territory followed by a few years of relative stability.   After the mid-90's things got interesting - for a decade, or so.  I've placed a lower trend line (red) connecting the bottoms, and a parallel (red) line more-or-less cross the tops.  This data doesn't fit this channel neatly, though, so I've also place a purple line that fits better across the tops.

The ultimate peak is then at the expanding channel top or an overshoot, depending on how you chose to think of it.  Then in '06, the RoC line crashed through the lower trend channel boundary.  That looks like a sharp V recovery, but we'll have to see how sustainable it is.  With unemployment remaining stubbornly high, lousy paying jobs replacing better-paying jobs, and increasing wealth and income disparity, it's hard to imagine what could drive a robust recovery.   I suspect the recent drop back below zero will be an important part of the story for several more years.  The backlog of foreclosures has gotten worse, not better, and until that clears, housing prices will remain stagnant, at best.

Back to the bubble - I'm going to suggest that when the YoY % change in the price of anything is in double digits and increasing, that is indisputable evidence that there is a bubble in that item.  No other confirmation is needed.   Even the decline in the '01-02 recession only brought the RoC down to about 8% - and that was brief.  By 2005, it was exceedingly clear that there was a housing bubble.  Greenspan is either a fool or a tool - quite possibly both.

There is also a lesson here about trends.  When the channel is broken in a convincing way, that trend is done.   Forever.   Whenever it is spoken of in the future, it will be as an item from the past.
______________________________________________

* Steve has a post containing the original version of this graph, and points us to a post by Tyler Durden at Zero Hedge that has several more.  Those posts aren't about the housing bubble, per se, but rather about how Wall St. is sucking money out of ordinary peoples' pockets, and thus the economy in general.

These are examples of more rentier activity, and detrimental to society.

We're screwed.


Tuesday, December 13, 2011

Rats!

As  a fitting follow-up to this exchange with Tux, Hartmann shows us why rats are more highly evolved  than Repubicans.


Link.

So, on the empathy scale we have Rats > Insane Clown Posse > Rethugs.

Seems about right.

Corporations United

Bernie Sanders on America, The Constitution and the buying of elections.


YouTube link.

H/T to the LW.

Monday, December 12, 2011

Busy

I will posting very little - if at all - for the next week or so.  This is the busiest week of the year for me.


Sunday, December 11, 2011

Quote of the Day

In comments here I asked BT if there was a difference between the current slate of Rethug presidential candidates and an insane clown posse.  His response:

Jzb, yes there is a difference. An insane clown posse has greater chance of having actual empathy for fellow human beings than the current crop of Republican lizard people from planet Sociopath.

Saturday, December 10, 2011

Saturday Hopeless Blogging

European style, via Peter Dorfman.

Absent a miracle, Europe is sliding into a recession.  This will affect Germany as much as the weaker countries, even more considering its dependence on Eurozone exports.  (Germany suffered an exceptionally sharp contraction post-Lehman too.)  The result will be a risk of debt deflation in all markets.  The sovereign debtors will again face default as public revenue dries up.  Speculative assets like real estate will resume their decline.  Overleveraged financial institutions—and Europe is the world leader in overleveraged finance—will need to be bailed out.  

Friday, December 9, 2011

Elizabeth Warren

I approve of her message.


Another H/T to the LW, who is on quite a roll tonight.

Bernie Sanders Petition

To Support the Saving American Democracy Amendment.

Sign the petition here.

Sen. Bernie Sanders has proposed a constitutional amendment that would overturn the Supreme Court decision in a case called Citizens United vs. FEC.  
  • Corporations are not persons with constitutional rights equal to real people.
  • Corporations are subject to regulation by the people.
  • Corporations may not make campaign contributions.
  • Congress and states have the power to regulate campaign finances.

I signed, and if America means anything to you, you should, too.


Oooh, I loves me some Bernie.

H/T to the LW.

Friday Hopeless Blogging

Can't say off the top of my head if I've ever given Mish a H/T.  He get's one today for this vid.


Here is an older version the ECRI leading indicator graph that flashed by pretty quickly in the Vid.  The last couple of years aren't shown, but if you were sharp-eyed, you saw the downward trend since the anemic post-trough peak.

Mish goes on to riff a bit on ECRI's many imperfections.  So - add salt, chipotle, and other flavorings to taste.

I'm pessimistic for my own reasons, of course, and have been for a long time.  GDP growth has not been in anything like recovery mode at any time in this century.  Unemployment remains high, and what job growth we see is mostly in low-pay sectors.  Housing prices in many places probably need to decline another 20%, at least,  to reach market clearing values. Wealth disparity, wrong-headed unwillingness to tax, and lax regulations have put us into a low-to-no growth box.  Private debt is a choking burden.

The Rethug controlled congress (yes, Virginia, they control the Senate too, with their filibuster-addicted, obstructionist minority) has as it's stated goal making Obama fail.  Taking the country down is of no consequence to these traitorous bastards.


What The Hell?!? Friday - Revenge of the Gay Heathens

In comments to Obama's War on Religion, Lynne points us to this snarky smack-down. 


Thursday, December 8, 2011

Obama's War on Religion

"Liberal attacks on our religious heritage?"  I can't tell which is the greatest - his stupidity, his insanity, or his belief that we are all crazy and stupid.   Then, again, maybe he just wants to capitalize on our collective ignorance.

Seriously -- WTF?!?


H/T to LGM.

Update:  What makes it even more disturbing is that now he claims to be off his meds.  (But is somehow grateful for stem cell research. Go figure.)

Wednesday, December 7, 2011

Misreading a Trend

At CR, one of the readers sent in a chart of the employment to population ratio, ages 16 and up.  That reader expects the ratio to increase to 65%, based on his view of the trend line.  Here is the post and here is a screen shot of the chart.

Bill McBride at CR says:  "I think this forecast is incorrect - and this gives me a chance to discuss the participation rate and employment-population ratio."

He goes on to give fundamental reasons for why he disagrees, and every bit of that is right.  You can also say that the forcast is incorrect just by taking a look at the trend.  Sorry the picture got fuzzy when I grabbed it.  The screen shot linked above should be crisp.


I'm not at all sure that the dotted trend line has any validity at all, but let's just go with it - or at least with a channel that is close to parallel to it, outlined in green.  The data line tops out at about 64.5% around 1999.  After a secondary peak around 63.5 and 2007, it's been a near-vertical drop.  The smash through the bottom of the channel - which I've placed a low as is reasonable - is dramatic and convincing.  It's been quivering just above the 58% level for a couple of years, now.  

It seems quite plain - I would say self-evident - that the old trend has been broken.

Calculated Risk has a follow-up post on employment to population, broken down by age group.  McBride concludes: "Forecasting the participation rate is important (along with population growth and other factors) in projecting how many jobs are needed to bring the economy back to full employment So I'll be writing more about this ..."


Food Stamps

Mish provides a chart on food stamp usageHere's a screen shot.

The most recent recession, that allegedly ended in 2009, is like nothing in living memory, unless you're a keen minded octogenarian.  Mish's reader, Tim Wallace, provided the graph, and an extrapolated estimate that the number of people on food stamps will rise from the current 46 million to about 51 million by 2013.

Extrapolations are dicey, and a linear extrapolation of a clearly non-linear function doubly so.

However that turns out, this does indicate that we are living in strange days.

Wallace notes: "that food stamp usage sloped down throughout the Reagan presidency until it started back up in 1989, ahead of the recession that doomed Bush I, then continued for several more years."  That drop was from roughly 22 million in 1981 to 18 million in 1988 - about 570,000 per year.  Under Clinton - not mentioned in Mish's excerpt from Wallace's e-mail, usage dropped from roughly 27 million in 1994 to 17 million in 1999 - about 1.67 million per year.

I don't know if either of them was trying to make a political point, but I sure am.

The unknown here is how requirements to recieve food stamps might have changed over time.  Did anything happen on that front during the Reagan years?

Update:  In comments to this post, Jerry Critter does the leg work on the Reagan question.  I've lifted his comment up to here.

According to Wikipedia "[m]ajor legislation in 1981 and 1982 enacted cutbacks" and "[r]ecognition of the severe domestic hunger problem in the latter half of the 1980s led to incremental expansions of the FSP in 1985 and 1987".

So, Reagan reduced the program and then was forced to expand it again because of too many starving people. At least he recognized his mistakes and tried, even if it was half-hearted, to correct them. He also raised taxes after first cutting them, again recognizing a mistake.

Today's republicans just say "Screw you".
Update 2:  Here's a NYT article on the history of food stamp usage.   And here is an Aug 1, 1981 article on the Reagan budget cut that affected the program.

Tuesday, December 6, 2011

Quote of the Day: "Brainwashing In The Most Obvious Form"

Thus sayeth the lovely Andrea Tantaros, with the typical conservatard tone deafness to (or hyperactive sense of - it's really quite hard to tell) irony.


OK, I guess that explains why flaming liberals like Eric Rauchway and - well - I are big Muppets fans

SoBe puts it in perspective and provides thoughtful analysis.

 Before watching this trailer for the obvious brain washing movie, you probably should ask impressionable children - and childish adults - to leave the room.


Monday, December 5, 2011

What are the Core Issues . . .

For a man who doesn't seem to have a core?


Sunday, December 4, 2011

Quote of the Day: "The Blueprint for Modern America"

In some of my more cynical moments, I think that, when the south seceded from the Union, President Lincoln should have just said, "The hell with them.  Let 'em go.  Who needs them, anyway?"

This would have been (and I am deadly serious) very good for the rest of us, but really, really bad for the south.  (If you think I need to elaborate, you need to give this some serious thought.  Hints: beneficiaries of federal programs (like TVA and rural electrification), net gains from federal taxation, locations of military bases, whatever social progress Selma, Alabama has reluctantly been dragged into.)

Even before the civil war, the south was a huge impediment to progress.  The 37th congress - the first to convene without southern representation, due to the secession - "did more than any other in history to change the course of national life. As one scholar has aptly written, this Congress drafted “ 'the blueprint for modern America.'

More than just a H/T:  Steve elaborates.

A Different Look At The Great Stagnation - Pt 2

For part 1, see here.


THE GOLDEN AGE AND THE GREAT MODERATION

The golden age was a period of strong, but sometimes erratic, economic growth.  To illustrate this, consider the quarterly rate of change since 1947 in gross domestic product (GDP.)   GDP is an aggregate measure of all the goods and service produced in the country.  It’s not perfect, but it is a reasonable barometer of the state of the economy, and growth rates tell you where it is headed.  The Bureau of Economic Analysis (BEA) provides relevant data in many forms.  Graph one is a data plot of quarterly percent change from the preceding period in real (inflation adjusted) GDP, seasonally adjusted at annual rates, from BEA. This plot is color-coded by presidential administration, blue for Democrats, and Red for Republicans.  As you can see, this number jumps around a lot, but less so in recent decades.  Also shown are the average values for all data from 1947 through 1980, 3.73%, in green, and the average from 1981 through the first quarter of 2011, 2.81%, in red.  Note that since 1981, average GDP growth has been almost a full percentage point lower than it was during the Golden Age.

Also shown is an 8 year moving average in yellow.  I chose an 8 year span for the moving average to smooth out over the length of a two-term presidency, but any long moving average will tell the same story. Until recently, the lowest dip in that (moving average) line bottoms out at 2.35% in 1982, and the highest bottoms out 2.71% in 1986, with no particular pattern across time.  The lowest bottom of all occurred in the recent Great Recession, bottoming out at 1.54% in the second quarter of 2009.  The dramatic change is in the tops. After a broad double peak from 1966 to 1969, topping out at 5.39% and 5.29%, the remaining peaks are between 3.99% and 4.07% - scarcely above the golden age total period average.  The other notable feature is the steady decline in quarterly data peaks throughout the G. W. Bush administration and the corresponding slide in the eight year average, culminating in the crash of 2007.


Figure 1

During the Great Stagnation, the reduced volatility in the quarterly GDP growth numbers appears in the graph as generally less severe bottoms, and even more dramatically as less expansive tops.  The degree of volatility can be precisely determined using the statistical technique of standard deviation.    The next graph shows how the standard deviation has changed since WW II.


 Figure 2

The blue curve is the standard deviation (Std Dev), based on the previous 34 quarters.  We’ll get to the red line later.  Sure enough, the Std Dev falls over time, as the blue best-fit trend line confirms, but it does not fall monotonically.

How can we account for this?  In the 50's, there was economic turmoil, as the economy restabilized during the first wave of the baby boom, and about 7 million soldiers reentered the work force following WWII - which came hard on the heels of the Great Depression.  This was a dynamic time, with wild growth peaks in 1950, '52, and '55, along with recessions in 1953, '58, and '59-60.  Then came the First Little Moderation  - a decade with steadier GDP growth and – most significantly, no recessions until late in 1969.   The 70's brought stagflation, the end of the Viet Nam war, and another series of wild gyrations in GDP growth - though, except for one spike in 1978, and the recession of 1980 - not as wild as the '50's. Reagan's high spending and deficits held recessions at bay after 1982, and volatility began to decline a few years later.   After a modest peak in late 1987, GDP growth declined as well, and the resulting recession contributed to denying George H.W. Bush a second term.  The Clinton administration gave us relative prosperity, along with the Second Little Moderation – another multi-year span without a recession.  Volatility remained steady at a low level throughout his two terms, before dropping further to an all-time low in 1999.  Despite this, his policies were too conservative to rekindle anything like a golden age. By 2000, the wheels were about to come off the Clinton boom anyway, but the grotesque economic policies of the George W. Bush  administration threw us farther over a deeper cliff than was necessary.  His profligate spending made Reagan look prudent, and gave us an anemic and declining series of GDP mini-peaks, culminating in the crash of 2007.  Barack Obama’s administration has not been able to foster significant growth and a robust recovery while dealing with a Congress dominated by blue dog Democrats and overtly obstructionist Republicans.  It’s particularly interesting that the recent Great Recession barely registers as a blip on the blue line.

Which brings us to the red line in Fig 2: relative standard deviation (RSD), determined by dividing the standard deviation by the average of the same 34 data points, here multiplied by 3.5 to put it on the same scale as Std Dev.  Part of the reason that the Std Dev became smaller over time is that the numbers used to calculate it were smaller. To this extent that this is operating, the Great Moderation is a meaningless data artifact.  However, if this were strictly true, the best fit line for RSD would be exactly horizontal.  It’s not, but it does have a smaller slope than does the best fit line for Std Dev, so the idea is not totally without merit.  Let’s have a closer look.

By the end of the first Little Moderation, RSD dropped to a level below that of most of the Great Moderation.  It then rose slightly, was stable from ’71 to ’73, and took a big jump with the recession of ’74.  After slipping over the rest of the decade, RSD shot to an all time high during the recessions of ’80 and ’82.  The big drop occurred between ’87 and ’90, and the low level was maintained until the Great Recession.

Volatility is the intensity of variability.  Big changes in short time spans register as volatility, causing Std Dev and RSD to increase.  As figure 1 shows, the biggest variations come from recessions and quick, strong recoveries.   There were three recessions in the 50’s so RSD never had a chance to decline.  The 60’s and the 90’s were both recession-free, so RSD could decline in the one case, and stay low in the other.  The recessions of the 70’s were deep, but the recoveries were strong, so volatility climbed.  The back-to-back recessions of ’80 and ’82, with sharp recoveries in ’81 and ’83 took RSD to an all-time high.  The Great Recession propelled RSD back up to a level not seen since the 80’s.  Simply, all of the volatility jumps can be explained in terms of recessions.  Avoid recessions, and Std. Dev. will be low.

How, then, do we explain the two Bush administrations, with their recessions in 1990 and 2001, but no jump in volatility?  In each case the fall into recession was not sudden – it followed several months of low or declining GDP growth.  Similarly, in each case, the climb back out of recession was slow, faltering, and failed to generate even a single quarter where GDP growth topped 7%.  In contrast, from WWII until 1983, top recovery quarters typically exceeded 10%.

What this indicates is that the Great Moderation really is a data artifact – though not quite in the way I expected.  Reduced GDP growth numbers play a part, but the real key is understanding how recessions contribute to observed Std Dev.  Recession-free times have low Std Dev values, and tepid recoveries from recessions that occur in a low growth context will also have low values.  While the Great Moderation is real, the standard explanation is inadequate, and comes from failing to look at the data with a critical eye.


________________________________________________

This was intended to be a chapter in a multi-author book project.  The project fell through for reasons not related to the project itself.


Friday, December 2, 2011

Quote of the Day

Michael Hudson:  (Somewhat ironically, that link was broken.  Here it is.) 


In more modern times, democracies have urged a strong state to tax rentier income and wealth, and when called for, to write down debts. This is done most readily when the state itself creates money and credit. It is done least easily when banks translate their gains into political power. When banks are permitted to be self-regulating and given veto power over government regulators, the economy is distorted to permit creditors to indulge in the speculative gambles and outright fraud that have marked the past decade. The fall of the Roman Empire demonstrates what happens when creditor demands are unchecked. Under these conditions the alternative to government planning and regulation of the financial sector becomes a road to debt peonage.

This powerfully reinforces what I said here and here (including the comments.)  Here, tooAlso here.  Check also the Mike Kimel and Andrew Dittmer links here.

H/T to Art.