Brought to you by -
Mike Kimel at A.B.
Andrew Dittmer at N.C.
Commenters at both places mention similarities to feudalism. Right up my ally, of course.
Here, at no extra charge, is my view of libertarian quasi-feudalism.
Wednesday, November 30, 2011
Tuesday, November 29, 2011
Quote of the Day
A rather long one from Hale "Bonddad" Stewart, with a H/T to A. B.
Kinda why we're so screwed, eh!
Let me address the political problem, because I think it's the really big elephant in the room. The Democrats can't lead. Period. The president sends a proposal to the Republicans and then offers the "pre-compromised" version before negotiations get out of the gate. He has yet to figure out that he is hated -- as in really hated -- because of what he symbolizes: the end of the WASP power structure as we know it. And Congressional Democrats have no backbone. Case in point: perennial pain in the ass Joe Lieberman should have been given an office by the janitor (with an apology to the janitor) along with every meaningless committee assignment possible. Instead, he's a media darling.
Republicans now have the luxury of living in a fact-free world thanks to Fox news and talk radio. Ever wonder why a mere 6% of scientists consider themselves Republicans? Because Republicans are now completely fact-free in a majority of their statements and policy proposals. Here is but one example: sometime over the last year, Paul Ryan proposed a new budget plan with economic analysis provided by the Heritage Foundation. The plan started to unravel after Paul Krugman noticed the plan projected unemployment at 2.3% at the end of the decade. After that, a group of people (of which I was one) shredded the plan -- as in demonstrated that it was put together by a third-grader with a crayon. It got so bad that Heritage eventually took it down only to erase the more egregious assumptions. That's just one example of how the fact free the Republican party has become.
Kinda why we're so screwed, eh!
Monday, November 28, 2011
It's Just Life. You Do What You Have To
"A quarter of a tank, and an orange."
There's nothing I can add.
Update: I guess what I can add is that watching this had me in tears.
H/T to the LW.
There's nothing I can add.
Update: I guess what I can add is that watching this had me in tears.
H/T to the LW.
Repost Ripost
A slightly edited version of my post from Feb 20, Federal Government Tax Receipts, was reposted today at Angry Bear, to my great delight. It has generated a lot of controversy. Basically, my stating that FICA, aka "the payroll tax" is a tax is getting some hard blow back.
More heat than light, though, it seems to me. Still, it's nice to have a wider audience.
More heat than light, though, it seems to me. Still, it's nice to have a wider audience.
Corporate Net Cash Flow - Pt 2
In comments, Art suggests looking at CNCF divided by the GDP Deflator to strip out inflation, and provides a link to the relevant FRED graph. I put trend channels on it, 'cuz - well, that's what I do.

The original post WW II (Golden Age) trend is indicated with a green channel. The more recent trend, with significantly lower slope, is in the purple channel. For the green channel, the orange midline (eyeballed) is included.
This begs the question: when did the trend actually change? When you have a time series that bumps and wiggles along, it's tough to say for sure. One could argue that the channel shift started with the the last touch to the top of the green channel in the mid 60's, since that is where I've drawn the beginning of the new channel. But, the new channel can often be extrapolated back into the previous channel. So, though that interpretation can be visually compelling, it isn't necessarily correct. One way to get a handle on trend changes is to look at the standard deviation envelope, as I did here for the Federal Funds Rate. I haven't done that here. I don't have the time right now, and probably lack the motivation to go at it that way.
Another approach is to see where the data stops exceeding the channel midline. I'm not going to suggest any kind of a rule, but I have noticed that stock market trends tend to fail at the midline rather than the top line of the trend channel. The last touch of the midline occurred just before the 1980 recession. The first local peak to fall short of the midline is the double peak in the mid 80's. Soon after, the data line pierces the bottom of the green channel for the first time.
I'm going to suggest that the trend change is located at the midline failurein the early 1980's. But if you would prefer a different milestone, I'm not going to argue strenuously against it. I would like to get your line of reasoning though. I think mine is rational, and consistent with other economic phenomena. What do you think?
Any way you slice it, though, policy over the last 30 (at least) years have not been as good for businesses as were the policies of the previous post-war period. My take-away is that Republican policies of low taxation, deregulation, lax enforcement, union busting, and job outsourcing have simply been bad for the country and bad for the economy - bad in every way. Even the corporations are doing less well in this neoliberal period than they did when Keynesian economics informed policy.
I infer from this that Republican policy is based on ideology, not on facts or data. But, of course, this is no surprise.
Sunday, November 27, 2011
Government Expansion and That Damned Denominator
Krugman has another frustration post, where he has to complain about "the claim that Obama has presided over a vast expansion of government —
a claim backed not by describing any specific programs, but by pointing
to the share of federal spending in GDP."
The perceptive reader already will know where this is heading.
Evidently, PK can also do math. He's calculated how much of the approximately 4% rise in Fed Spending/GDP is due to the main contributing factors. Here is his pie chart. (Mmmm -- pie!)

He concludes:
The perceptive reader already will know where this is heading.
Well, part of the answer is that the ratio is up because the denominator is down. According to CBO estimates, in fiscal 2010 the economy operated about 7 percent below potential. This means that even if what the government was doing hadn’t changed, the federal spending share of GDP would have risen by 1.4 percentage points.
Then, look inside the budget data (pdf), specifically at Table E-10. You’ll see a surge in spending on “income security”; that’s basically unemployment insurance, food stamps, and similar items. In other words, spending on safety-net programs is up because the economy is depressed, and more people are falling into the safety net.
Evidently, PK can also do math. He's calculated how much of the approximately 4% rise in Fed Spending/GDP is due to the main contributing factors. Here is his pie chart. (Mmmm -- pie!)
He concludes:
What’s in that “other” category? Some of it is stimulus spending. Some of it is the leading wave of the baby boomers, who are starting to collect Social Security and enter Medicare. Some of it is rising health care costs.
What isn’t there, no way, nohow, is a massive expansion of government, which is a figment of the right wing’s imagination.
Corprate Net Cash Flow
Connecting peak to peak a la Krugman, since 2005, CNCF seems to have established a new trend line (red) at slightly lower slope than the trend line from the late 90's (blue.) This, in turn, has a lower slope than the previous trend line (green) from about 1985.

You'll have to believe me when I tell you a few historical facts (or go to FRED and look them up yourself.) First, the green line slope is virtually identical to that from 1950 through the early 1970's. Second, the slope from the late 70's through '85 was greater than the green line slope (you can see that in this chart if you look to the left.) Third, the slope through the mid 70's was greater still.
Restated, the growth of CNCF has never been slower in the post WW II period than it is right now. Yet Karl Smith is excited about current growth, is making optimistic predictions about 2012, and expects inflation.
My comment:
Karl and I can't both have it right. Which of us do you think is wrong, and why?
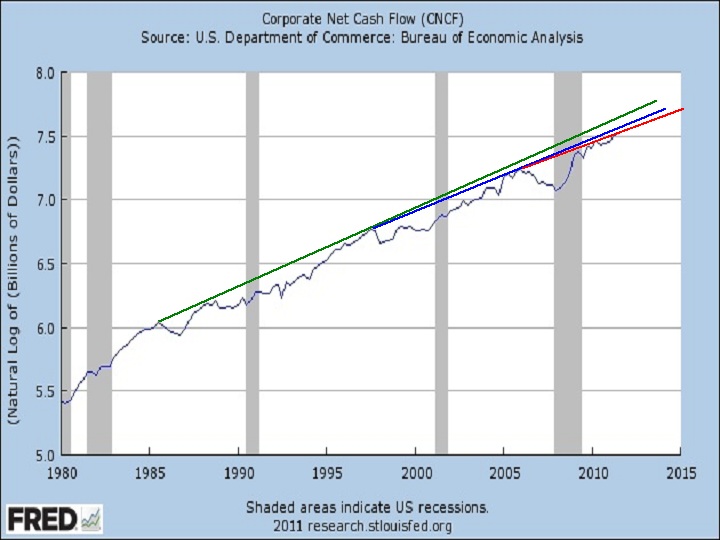
Thursday, November 24, 2011
What I'm Thankful For
First off for my family - my lovely wife, who is my greatest supporter, biggest fan, and the love of my life; for our offspring, who gave me an anchor and enriched my life in more ways than they can possibly know; for our 11 smart, talented and beautiful grandchildren, who have been bringing us joy for a decade and a half, and give me hope for our future; for my mom, always there for me in a time of need, and still going strong at 90, and my sister, who brings us both strength; for nephews, nieces, cousins, and in-laws, who I don't get to see as often as I would like.
I love and appreciate you all.
I'm thankful for free speech, and the opportunity to exercise it that this blog provides; and for anyone who stops by to read, especially if you leave a comment.
I am very fortunate to have grown up where and when I did, as part of the only generation for whom the American Dream was a realistic expectation. I'm thankful for the New Deal, that made America great, and the Great Society, which greatly reduced poverty, and moved us in the direction of equality and opportunity for all. I'm thankful for the opportunities I had: affordable education, a robust economy so I could find employment in young adulthood that was more than just a job; for American industry that gave me a career and a pension, for Social Security that allows me to have a comfortable retirement.
In my youth, my father often tried to impress on me how lucky I was to have all of these dreams, opportunities and expectations. I did not get it then, but I do now. We bumped heads - a lot - and I can't say it was all my fault. But he gave me perspectives I otherwise would not have known, a foundation in duty and responsibility, a passion for education, and a healthy skepticism.
Dad's been gone a long time. Our relationship was never easy, but he did a lot for me. Rest easy, dad. I'm thankful for you, too.
And, of course, for music, the great natural anti-depressant; along with all my musical friends and fellow noise-makers.
Oh - can't forget all my friends at the Crossword Corner.
Peace, love and joy to all on this Thanksgiving day.
Wednesday, November 23, 2011
What is the Contribution of the Finance Sector?
From earlier today, Krugman points to an article by Andrew Haldane, coincidentally having the same title as this post. PK lifts this Notable Quote:
PK's post was titled: "A Gigantic Scam." He concludes:
I saw Haldane's article reposted at Naked Capitalism yesterday morning, and left this comment. It generated some very favorable responses from other readers, some of whom told me that I did, indeed, miss things. Those blanks are well worth filling in. Check it out at the link.
Have I ever mentioned that I love it when Krugman agrees with me? But it gets even better. I chopped veggies this afternoon, too!
Happy Thanksgiving, everyone.
In fact, high pre-crisis returns to banking had a much more mundane explanation. They reflected simply increased risk-taking across the sector. This was not an outward shift in the portfolio possibility set of finance. Instead, it was a traverse up the high-wire of risk and return. This hire-wire act involved, on the asset side, rapid credit expansion, often through the development of poorly understood financial instruments. On the liability side, this ballooning balance sheet was financed using risky leverage, often at short maturities.
In what sense is increased risk-taking by banks a value-added service for the economy at large? In short, it is not.
PK's post was titled: "A Gigantic Scam." He concludes:
And he suggests that much if not all of the rise in the share of finance in GDP reflected this deception; in effect, Wall Street and the City were con artists extracting huge rents from an unwary public (and eventually dumping much of the cost, when things went bad, on taxpayers).
A lot more to say about this — but I’m needed in the kitchen to chop vegetables.
I saw Haldane's article reposted at Naked Capitalism yesterday morning, and left this comment. It generated some very favorable responses from other readers, some of whom told me that I did, indeed, miss things. Those blanks are well worth filling in. Check it out at the link.
So, to summarize:
1) Over the last 30 years banking has devolved from a necessary financial function involved in the allocation of resources and management of risk to essentially non-value-added rent-seeking activities implemented through high risk practices.
2) When the whole house of cards came tumbling down, the losses were socialized, while the criminals who perpetrated the underlying fraud walked off not only scot-free, but with huge bonuses.
Did I miss anything?
This is how we’ve been screwed for decades.
JzB
Have I ever mentioned that I love it when Krugman agrees with me? But it gets even better. I chopped veggies this afternoon, too!
Happy Thanksgiving, everyone.
Tuesday, November 22, 2011
Look Mom, No Future

This absolutely adorable six-year-old girl is named Abigail. I'm listening to her dad talk to Randi Rhodes as I write this. He's a big occupy supporter. And so is she.
And so am I.

Mitt Romney is a God-Damned Liar
Stumbled across this at Yahoo, but also got wind of it from the LW this morning.
The title of the Yahoo article, "Romney turns up the heat on Obama in New Hampshire," is horribly misleading. It should say, " Romney tells bare-faced lies about Obama in New Hampshire."
Here is the HufPo link from the LW, correctly titled: "Obama Campaign Blasts Romney's First TV Ad As 'Deceitful'"
Serial deceiver strikes again. God-damned liar is more on the mark.
The title of the Yahoo article, "Romney turns up the heat on Obama in New Hampshire," is horribly misleading. It should say, " Romney tells bare-faced lies about Obama in New Hampshire."
Democrats on Tuesday took issue with the part of the ad that quotes Obama saying, "If we keep talking about the economy, we're going to lose," pointing out that Romney took the quote out of context. Obama used the line in 2008, but he was talking about his opponent, Arizona Republican Sen. John McCain, not his own campaign. What Obama did say at the time, was this: "Senator McCain's campaign actually said, and I quote, 'If we keep talking about the economy, we're going to lose.'" In response, the Democratic National Committee slammed Romney, calling him "a serial deceiver."
Here is the HufPo link from the LW, correctly titled: "Obama Campaign Blasts Romney's First TV Ad As 'Deceitful'"
Serial deceiver strikes again. God-damned liar is more on the mark.
Brutal Police Assault Causes Miscarriage
I just heard about this on Thom Hartmann's program.
Here's a write-up. According to one of Hartmann's callers, the liberal-biased MSM in Seattle is refusing to cover the story.
“I was standing in the middle of the crowd when the police started moving in,” she says. “I was screaming, ‘I am pregnant, I am pregnant. Let me through. I am trying to get out.’” At that point, Fox continues, a Seattle police officer lifted his foot and it hit her in the stomach, and another officer pushed his bicycle into the crowd, again hitting Fox in the stomach. “Right before I turned, both cops lifted their pepper spray and sprayed me. My eyes puffed up and my eyes swelled shut,” she says.
When are we going to start filling the privately-owned prison system with these uniformed criminals?
Trends
The trend is your friend; but when does it end?
Here's a look at the Federal Funds Rate since the mid-80's. The rate has gone through several cycles since an arbitrary start date of 1984, chosen to get a good close-up view of action over the period. The Fed changes the FFR whenever they feel like it, so the data points are not evenly spaced. The FFR is shown in blue, a 21 point exponential moving average* in yellow, and an envelope + and - one standard deviation - based on the same 21 points - from the average in red and green, respectively.

My Excel data file doesn't say where the data came from. Shame on me for carelessness. It may have been from FRED. If you're interested in the data and calculations, send me an email, and I'll send you the file.
The FFR goes on excursions, and spends a lot of time hugging one of the envelope boundaries. When it makes a move back inside the envelope by crossing a red or green line, it typically indicates a change in direction is about to occur. For this data set, crossng the red line appears to be more relaible than crossing the green line.
No indicator is perfect. Green line cross-overs give a couple of false signals, circled in purple. In each case, though, a real change did follow, eventually. In the first case, July, '85, the real shift was over a year later, in Dec. 1986, and about 1.5% lower. The Jan. '02 false signal was about 12 months early, and .3% high from the real cross-over, and .55% above the ultimate bottom.
Using signals together can be helpful. Here is the FFR again, this time shown with the Standard Deviation, multiplied by 5 to put it on a comparable scale.

Not every bottom in the StD corresponds with a bottom in the FFR. But, every bottom in StD that follows a green line cross-over does signal that the FFR is about to turn up. Note that the July, '85 crossover occurred when the StD was high and rising. There is a little blip in StD in the second half of '03, concurrent with the start of the ultimate bottom, a flat spot around 1% running from July, '03 through May, '04.
These two signals working together gave a very reliable indication of trend changes over a period of two and a half decades.
We are now in a region that is unprecedented. The FFR is hugging 0, and so is the StD. These things can only go up from here; but who can say if or when it will ever happen? Since the FFR topped in 1981, it's been a series of lower highs and lower lows. The lows have hit bottom. Highs - should we ever get any - could possibly continue to trend lower.
_________________________________________
* The problem with a simple moving average is that every early point in your data packet has the same weight as the most recent one. An exponential moving average weights the most recent data point. A series of points thus weighted skews the average towards the most recent action. Any moving average is backward looking - there's no help for that. But an exponential moving average increases the importance of recent data, and yields a more responsive, quicker moving average line.
Wealth Map

Swiped this from Asymptosis. Despite the citation to the right of the pic, I'm unable to locate the source.
Monday, November 21, 2011
Income - Part 2
In comments, Steve asked for a graph of the difference between median and mean income, "y axis appropriately scaled so we can see when the big median/mean divergences happened." Happy to oblige. In the original graph, the difference line was dwarfed by the mean and median values.
Zeroing in on the difference, we see that it grew from about $3500 (constant 2008 dollar basis) to a peak of $20,192 in 2006. It then backslid to $18,113 in 2008. Other dips occur in 1958-9, 1975-6, 1991-2, and 2002: each at or within a year of a major recession - quite a painful way to strike a feeble blow for equality. By this criterion, the entire 21st century thus far has been an economic doldrum. I hope you didn't need this data bit to be so informed.

I had Excel throw an exponential best fit line on the dataset. With some wiggles, it's not a bad match, overall, with R^2 = .9617. The exponent is .0326.
The biggest gain in the spread came, of course, in the Reagan - Bush I years, growing from $7837 to $15057, a gain of 92% over 12 years. During the Clinton term it increased to $18806, or 24.89% during those 8 years.
For what it's worth, here is a plot of year over year % change in the difference.

This is color coded by President's party, from year 2 of an incumbent party's term to year 1 of the new party's term, when there is a change. I figured that the first year of any President's term is based on the preceding executive's budget and policies, and it takes a while to implement new policies. Note also that there is a spike in the first year of each new democratic Prez, and a drop in year 2. This is what made me think to code it this way.
Also included are an average for the entire set, 2.7%, in purple, a 5 year moving average, in yellow, and term averages from year 2 to term end + 1 for each president. Kennedy-Johnson and Nixon Ford are taken as single administrations; Reagan and Bush I are separated. Dem administration averages typically hug the long average line, while Rethug administrations run mostly above it. The exceptions are Truman and Shrub, both falling far below the long average line.
The single big spike is the difference growth from 1992 to 1993, when mean income recovered a full year ahead of median income, as seen in the original graph.
This data set ends in 2008, so none of the results of Demopublican president B. Hoover Obama are indicated.
Sunday, November 20, 2011
U.C. Davis
If you see Davis, it's because the whole world is watching.
Yesterday, U.C. Davis History Professors Eric Rauchway and Ari Kelman posted from their normal Edge of the West gig about the unprovoked assault on passive student protesters, and reposted as a guest blog at Crooked Timber today.
I'm not going to editorialize about the brutal and criminal police actions. (Video is embedded at the links.) They speak more loudly and eloquently on their own than I could with any verbal embroidery.
In comments at CR, we find links to reactions from other U.C. Davis Professors.
Bob Ostertag:
Nathan Brown, in an Open Letter to Chancellor Linda P.B. Katehi:
These chancellors are part of the servitor class - lizard people who are minions to the wealthy elite who are eating at the core of American democracy.
These professors are brave and principled men who dare speak truth to power.
They - and the student protesters - give me hope (however minuscule) that all will not be lost.
Yesterday, U.C. Davis History Professors Eric Rauchway and Ari Kelman posted from their normal Edge of the West gig about the unprovoked assault on passive student protesters, and reposted as a guest blog at Crooked Timber today.
I'm not going to editorialize about the brutal and criminal police actions. (Video is embedded at the links.) They speak more loudly and eloquently on their own than I could with any verbal embroidery.
In comments at CR, we find links to reactions from other U.C. Davis Professors.
Bob Ostertag:
Chancellor Robert Birgeneau thus joins the likes of Bull Connor, the notorious segregationist and architect of the violent repression of the civil rights movement in Birmingham, Alabama, as some of the very few people who view the non-violent tactics of Martin Luther King as violent.
Nathan Brown, in an Open Letter to Chancellor Linda P.B. Katehi:
I call for your resignation because you are unfit to do your job. You are unfit to ensure the safety of students at UC Davis. In fact: you are the primary threat to the safety of students at UC Davis. As such, I call upon you to resign immediately.
These chancellors are part of the servitor class - lizard people who are minions to the wealthy elite who are eating at the core of American democracy.
These professors are brave and principled men who dare speak truth to power.
They - and the student protesters - give me hope (however minuscule) that all will not be lost.
Income
I generated this graph a while back, but evidently never posted it. It shows the spread between mean and median income. If the mean is greater then the median, income is skewed to the top half of the population. Greater spread means greater skew. It's that simple.

Somewhere along the line, I had a computer crash and lost the data file this graph came from. So - I don't know what dollar basis this chart uses.
Here, below, is a more extensive graph. Same story, but different numbers. Data is from the Census Bureau, Table 696. Click the top link at this Google search and it will download the data file. I got this from an earlier version, in constant 2008 dollars. Current download version is in constant 2009 dollars.

Top Line in the graph is mean income, second line is median income, bottom line is the difference. Each line is color coded by President's party: Rethugs in Red, Demos in Blue. For the difference line, Rethugs are in yellow, Demos in purple.
There was not a lot of disparity growth through the 50's. It stepped up every decade, until the most recent. Well, the rich are going to get richer. I think I read that somewhere. Except for the Shrub administration. That was close to dead flat for everyone, so the difference didn't even change.
Note, though, that the really big change comes from Reagan, and especially Bush 1. The big jump from 92-93 happened because mean incomes recovered a year before median incomes did. Disparity grew through the Clinton years, but at a slower pace. Then Shrub happened, and it was the doldrums, or worse, for everyone. A decade of zero wealth generation.
No wonder conservatives love him.
Thursday, November 17, 2011
That Aggregate Demand Thang
Karl has a thoughtful and insightful post, stating:
He has a couple of graphs to indicate the gap. Graph 1, Personal Consumption Expenditures, shows a recovery from the '09 low to a new recovery high, above the late '07 pre-recession peak. (See it at the link.) But this metric includes a few items that are either non-discretionary or totally outside of the consumer's control, like bank profits (!?!)
Graph 2 is more relevant. It indicates retail and food service spending. Again not 100% discretionary, but a lot closer. By thiis metric, we have not yet attained a new recovery high, and might actually be leveling again.
In conclusion, Karl asks:
My response:
All that having been said the proximate cause of the slump is a sharp decline in consumer spending from which we have not recovered.
He has a couple of graphs to indicate the gap. Graph 1, Personal Consumption Expenditures, shows a recovery from the '09 low to a new recovery high, above the late '07 pre-recession peak. (See it at the link.) But this metric includes a few items that are either non-discretionary or totally outside of the consumer's control, like bank profits (!?!)
Graph 2 is more relevant. It indicates retail and food service spending. Again not 100% discretionary, but a lot closer. By thiis metric, we have not yet attained a new recovery high, and might actually be leveling again.
In conclusion, Karl asks:
We don’t think their desire for consumption has somehow become completely sated. This implies that there is some price at which they would want to buy more real goods and services. Yet, the market does not find that price.
Why?
My response:
Excellent post, Karl. Thank you.
The market does not find that price because too many people can't afford to pay it. Real unemployment is still around 16%, and new job creation is at a far lower wage scale than that of the old jobs that were destroyed. I think this is fairly obvious.
Also, every penny generated by GDP improvements and productivity gains over the last 3+ decades has gone to the top two quintiles, and within them, disproprtionally to those at the top. The skew is greater the higher you go.
Today's generation of young adults makes less real income than their parents generation did 30 years ago. The American dream literally is dead.
Back to graph 1 - Even if the new trend line were more or less parallel to the old trend line (by my eye it has a lower slope), it is running about half a trillion dollars lower. At parallel trend, that gap will never be filled. At lesser slope, the gap widens every day.
This cries out for fiscal policy, which is not forthcoming.
We're screwed.
Sunday, November 13, 2011
Quote Of The Day - "Oops!" Edition
Maybe it should be "Jack-Booted Thugs" Edition.
"He's very well respected and liked. People are angry," the lawyer said. "If this can happen to a pillar of the community, it can happen to anyone."
Osama Siblani, publisher of The Arab American News in Dearborn, said he called the Dearborn police chief and the FBI to let them know Hammoud was the wrong man.
"This is not the end of the world but it's no small thing," Siblani said. "The charges are unbelievable. He has raised three doctors, a very down-to-earth guy. For me to even imagine he would do something like this is beyond my imagination."
Then, again he IS a Muslim!
H/T to the L/W.
Deep Stupid #21
I rarely do DEEP STUPID posts any more. The process of researching and composing line-by-line refutation and ridicule is so time and energy consuming that I just can't do very much of it.
Here is one that speaks for itself - and so loudly, that all I have to do is post it.
Oh, what the hell -- Bachman evidently doesn't realize that China has protective tariffs, manipulates its currency, pirates software and other proprietary technologies, keeps costs low by polluting their own air and water, selling sub-standard, poisonous products, and has a labor system somewhere in the general neighborhood of feudalism.
Also, here's some commentary from TPM, where I swiped the video.
Via HuffPo. H/T to the L/W.
Here is one that speaks for itself - and so loudly, that all I have to do is post it.
Oh, what the hell -- Bachman evidently doesn't realize that China has protective tariffs, manipulates its currency, pirates software and other proprietary technologies, keeps costs low by polluting their own air and water, selling sub-standard, poisonous products, and has a labor system somewhere in the general neighborhood of feudalism.
Also, here's some commentary from TPM, where I swiped the video.
Aside from the basic absurdity of crediting a country that’s still officially communist with avoiding the pitfalls of the welfare state, it’s worth noting that Bachmann’s broad condemnation of LBJ’s legislative record is in open conflict with her own political positions. She has repeatedly positioned herself as a staunch defender of Medicare, the centerpiece of the Great Society programs, and has slammed President Obama for using funds from the Medicare Advantage program to help finance the Affordable Care Act. Her critique of saving for “retirement security” also runs up against her stated support for Social Security.
“Social Security and Medicare provide a safety net to millions of Americans,” an issues page on her website reads. “This is a system that many Americans have paid into their whole life. America needs to keep its promise to senior citizens.”
Via HuffPo. H/T to the L/W.
Friday, November 11, 2011
We Are Poorer than We Should Be
Reading this post at Tux's reminded me of something I wrote for a project that will probably never see the light of day in its originally intended form and format.
Here, then, is the opening of what was intended to be a chapter in a book.
Part 1.
A DIFFERENT LOOK AT THE GREAT STAGNATION
It's no secret that the general economic environment in the U.S. has changed dramatically since some poorly defined moment within a few years of 1980. The dramatic decrease in the volatility of aggregate economic activity is commonly known among economists as The Great Moderation. The traditional view (circa 2005) was that this is a good thing, resulting from the absence of energy price shocks, improved monetary policy, and better inventory management techniques. This interpretation looks pretty hollow in the wake of the 2007 recession, when the economy collapsed, monetary policy was reduced to relative impotence, and energy price shocks are again dominating the economic landscape.
My view is that the volatility reduction is the result of a gradual decline in economic health over that time period – what skeptics like me call The Great Stagnation. In fact that is the title of a recent e-book by George Mason University economist Tyler Cowan.
I'm a bit on the skeptical side of agnosticism regarding Cowan's main point – that we have run out of low hanging technological, financial, and resource-based fruit. The technology claim, if it has any merit at all, might be an artifact of a slow down in government spending at all levels – coincidentally, also since about 1980. I’ll let those with more specialized knowledge sort out the rest of Cowan’s claim. My position is that, while Cowan's argument might (or might not) have some intrinsic value, it largely misses the point.
More on the mark is Cowan's corollary – that we are poorer than we realize. He thinks measurement techniques currently in vogue overstate our wealth. While this may be true, there is plenty of data available to demonstrate in directly measurable ways that, in the aggregate, we are poorer than we should be. And what makes this even worse is that growing income and wealth disparities have led to an economically top-heavy society that is probably unstable. Ultimately, this will require either effective mechanisms to redistribute wealth downward, or effective mechanisms to repress an increasingly impoverished and unruly population. The latter could be accomplished by a stark and impenetrable stratification of society into haves and have-nots – the kind of forced repression that leads to either South American style banana republicanism or 12th century European style feudalism. On the other hand, forced redistribution led to America's post WW II golden age.
I have not been a long-time observer of the deterioration of the human condition, so I did not have a keen view of the long, slow slide that has been taking place since the post WWII golden age ended. My awakening came with the impeachment of Billy-Bob Clinton, our first Bubba President. This, for me was a real WTF?!? event. To say there was no there there is to wildly overstate the significance of Clinton's history of dalliances with various consenting adults.
With my eyes thus opened, I watched theelection appointment of The Shrub with a combination of horror and disgust. His plan to ruin America by going to war while simultaneously cutting taxes was a success that even Grover Norquist would have had trouble hoping for.
And now we have some significant minority (oh god, please let it be no more than that) of the American people openly embracing a rouge's gallery of even worse Rethug presidential hopefuls. People who cheer for Herman Cain's claim to be a surrogate Koch brother, and increase their donations in the light of his sexual harassment revelations.
The intellectual nihilism of conservatives is perfectly demonstrated by Shrub, Cheney, McCain, Cain, Bachman, and most especially by the idiotic Rick Perry. You see, it takes anti-intellectualism, ignorance or outright dishonesty to embrace the Rethug policies of upward wealth redistribution, and all that they imply.
I am seriously fearful of the world we will hand to my grandchildren - now aged from 4 to 14. We are on a road to to deep repression or revolution, and eventually, perhaps, even another World War.
Here, then, is the opening of what was intended to be a chapter in a book.
Part 1.
A DIFFERENT LOOK AT THE GREAT STAGNATION
Anyone who believes exponential growth can go on forever in a finite world is either a madman or an economist.
– Kenneth E. Boulding
It's no secret that the general economic environment in the U.S. has changed dramatically since some poorly defined moment within a few years of 1980. The dramatic decrease in the volatility of aggregate economic activity is commonly known among economists as The Great Moderation. The traditional view (circa 2005) was that this is a good thing, resulting from the absence of energy price shocks, improved monetary policy, and better inventory management techniques. This interpretation looks pretty hollow in the wake of the 2007 recession, when the economy collapsed, monetary policy was reduced to relative impotence, and energy price shocks are again dominating the economic landscape.
My view is that the volatility reduction is the result of a gradual decline in economic health over that time period – what skeptics like me call The Great Stagnation. In fact that is the title of a recent e-book by George Mason University economist Tyler Cowan.
I'm a bit on the skeptical side of agnosticism regarding Cowan's main point – that we have run out of low hanging technological, financial, and resource-based fruit. The technology claim, if it has any merit at all, might be an artifact of a slow down in government spending at all levels – coincidentally, also since about 1980. I’ll let those with more specialized knowledge sort out the rest of Cowan’s claim. My position is that, while Cowan's argument might (or might not) have some intrinsic value, it largely misses the point.
More on the mark is Cowan's corollary – that we are poorer than we realize. He thinks measurement techniques currently in vogue overstate our wealth. While this may be true, there is plenty of data available to demonstrate in directly measurable ways that, in the aggregate, we are poorer than we should be. And what makes this even worse is that growing income and wealth disparities have led to an economically top-heavy society that is probably unstable. Ultimately, this will require either effective mechanisms to redistribute wealth downward, or effective mechanisms to repress an increasingly impoverished and unruly population. The latter could be accomplished by a stark and impenetrable stratification of society into haves and have-nots – the kind of forced repression that leads to either South American style banana republicanism or 12th century European style feudalism. On the other hand, forced redistribution led to America's post WW II golden age.
I have not been a long-time observer of the deterioration of the human condition, so I did not have a keen view of the long, slow slide that has been taking place since the post WWII golden age ended. My awakening came with the impeachment of Billy-Bob Clinton, our first Bubba President. This, for me was a real WTF?!? event. To say there was no there there is to wildly overstate the significance of Clinton's history of dalliances with various consenting adults.
With my eyes thus opened, I watched the
And now we have some significant minority (oh god, please let it be no more than that) of the American people openly embracing a rouge's gallery of even worse Rethug presidential hopefuls. People who cheer for Herman Cain's claim to be a surrogate Koch brother, and increase their donations in the light of his sexual harassment revelations.
The intellectual nihilism of conservatives is perfectly demonstrated by Shrub, Cheney, McCain, Cain, Bachman, and most especially by the idiotic Rick Perry. You see, it takes anti-intellectualism, ignorance or outright dishonesty to embrace the Rethug policies of upward wealth redistribution, and all that they imply.
I am seriously fearful of the world we will hand to my grandchildren - now aged from 4 to 14. We are on a road to to deep repression or revolution, and eventually, perhaps, even another World War.
Sunday, November 6, 2011
Sunday Music Blogging
Granddaughter Rebekka is in a children's theater version of ALLADIN. We're going to see it this afternoon.
That reminded me of this song, from the Disney movie version, that we played with the incomparable Wayne Bergeron at our Spring concert. Here he is doing FRIEND LIKE ME with his own band.
No vid - just a still shot of the recording studio. Sit back close your eyes and enjoy. Andy Martin on trombone, Bill Liston on tenor. Seriously awesome!
UPDATE: Turns out this was a Disney Junior production, so the song was actually in it. Not exactly this version, though.
Knight's Castle
A request by Ari at EotAW for books to recommend to his precocious 9-Yr-old son reminded me of a favorite book from that time in my life
My comment:
As a kid, I was enthralled with the middle ages - and dinosaurs, too, but that's a different story.
Was there a book that you were especially fond of as a child?
My comment:
I was 9 or 10 when I found KNIGHT’S CASTLE by Edward Eager at the Locke Branch Library in Toledo. Absolutely loved the dreamy magic realism. It’s a fine example of moral fiction that is not preachy. The story involves siblings and cousins, and does an excellent job of presenting the girls as equal to the boys, while recognizing each as a unique individual. This book was originally published in 1956! Went on a quest to find it again when my son was about 10. Fast forward: my wife gave me a set of Eager’s books a few years ago, and I read them with my grandsons – to their great pleasure.
That’s when I learned that Eager was from Toledo, also.
As a kid, I was enthralled with the middle ages - and dinosaurs, too, but that's a different story.
Was there a book that you were especially fond of as a child?
Friday, November 4, 2011
What the Hell Friday - Herman Cain Edition
I just heard Rachel and Eugene Robinson discussing the extraordinary weirdness of the Herman Cain campaign - if it is indeed a campaign. They were speaking of it as performance art. I have to admit that never occurred to me, and now it reminds me a bit of Pat Paulson.
The even weirder thing about this video is that the crowd cheers - wildly and with reckless abandon - when Cain says," I am the Koch brothers brother from, another mother." OK - it was at a function sponsored by the Koch brothers group Americans for Prosperity.
If this is parody, it's brilliant, maybe even genius. If it's real, then Cain is an inestimable buffoon.
The weirdest thing of all is that I seriously have no idea which of these propositions comes closer to the truth.
Source.
Thursday, November 3, 2011
Quote of the Day: Tim Duy On The Fragile Economy
At Fed Watch
Bottom Line: With all attention focused on the Greek drama, plus the well-received Q3 GDP report, it has been easy to overlook the underlying fragility in the US economy. This was especially the case when US equities looked to be on a nonstop trip to the moon. Perhaps the US economy can squeak through the next few quarters, and perhaps, in contrast to my expectations, Europe is able to bring an end to the crisis with limited collateral damage to the economy. But I can't shake the feeling that the US economy closer to running on fumes than is commonly believed, and will run out of gas in a very hostile global environment.
Bottom Line: With all attention focused on the Greek drama, plus the well-received Q3 GDP report, it has been easy to overlook the underlying fragility in the US economy. This was especially the case when US equities looked to be on a nonstop trip to the moon. Perhaps the US economy can squeak through the next few quarters, and perhaps, in contrast to my expectations, Europe is able to bring an end to the crisis with limited collateral damage to the economy. But I can't shake the feeling that the US economy closer to running on fumes than is commonly believed, and will run out of gas in a very hostile global environment.
The Ruling Clawss
Thanks to Eric at Edge of the West, we learn that children's author and illustrator Syd Hoff "had a radical alter ego, a Mr. Redfield who drew cartoons for the Daily Worker."
Here is a gallery of Redfield's work, collected as The Ruling Clawss in 1935. The vast majority of these sharply pointed political cartoons resonate with startling clarity 66 years later.
Check it out.
Here is a gallery of Redfield's work, collected as The Ruling Clawss in 1935. The vast majority of these sharply pointed political cartoons resonate with startling clarity 66 years later.
Check it out.
Inequality Trends in One Picture
Via Krugman, from the CBO Report.
I've seen other graphs that tell this story, but this is the most succinct.

That's how can tell that this is not capitalism: capitalist competition would prevent this top-heavy aggregation. What we have is crony (pseudo) capitalism, corporatism, and near-monopolies. Every one of these business practices is anti-competitive, and therefore anti-capitalist.
I've seen other graphs that tell this story, but this is the most succinct.

Just about all of the redistribution has taken place from the bottom 80 to the top 1 (and we know that most of that has actually gone to the top 0.1).
It’s a tiny minority, not a broad class of well-educated Americans, who have been winning here.
That's how can tell that this is not capitalism: capitalist competition would prevent this top-heavy aggregation. What we have is crony (pseudo) capitalism, corporatism, and near-monopolies. Every one of these business practices is anti-competitive, and therefore anti-capitalist.
Wednesday, November 2, 2011
Tuesday, November 1, 2011
Channel Surfing
Art ponders trend lines and channels. I have some thoughts, which I shared in comments there. I also have another post in the works, which might go up tomorrow.
Meanwhile, I've taken a look at the last few months of stock market activity, and thought about the opportunity to define trend lines and channels with that set of real world data.
You can see it here.
Meanwhile, I've taken a look at the last few months of stock market activity, and thought about the opportunity to define trend lines and channels with that set of real world data.
You can see it here.
Tebow, Part 2
The NFL, in many and varied ways, is a cruel place to try to make a living. Every Sunday, as you struggle to do your job, there are 11 other guys out there, and there job is to make you fail*. Not only that, but they are among the very best in the world at their job - which, once again, is making you fail at yours.
In this context, the Quarterback is the center of attention. Spectators, commentators, opposing linemen and blitzing safeties all have him in the cross hairs. Rookie quarterbacks are especially vulnerable, not having the knowledge and experience to comfortably handle their offensive systems or read and react to pro-level defensive schemes, nor having complete mastery of the pro quarterback's skill set.
A few notably exceptional quarterbacks have achieved a high level of success in their rookie years, and gone on to stardom - Dan Marino, John Elway, and Jim Kelly are the classic examples. Others like Troy Aikman, Drew Bledsoe, and even Payton Manning had rough starts, but went on to achieve stardom. Mediocre to poor careers, like those experienced by Charlie Batch, Brady Quinn and Kyle Orton are more common.
This year, there are a few rookie QB's who could be standouts: Cam Newton, Andy Dalton and Christian Ponder. Notably absent from this list, though, is Tim Tebow. His peformance against the Lions on Sunday was dismal. The previous week against the vastly inferior Dolphins, he was mostly inept, but had a strong finish and managed to pull out an 18-15 victory in O/T.
Tebow is an earnest Young man. There is no doubting his sincerity, effort, or character. What is highly questionable, though, is his ability. He only has a few starts, so the data set is small, and you need to be cautious about drawing broad conclusions. The cause for worry, though, is his lack of improvement. You have to believe (or at least hope) that the Broncos coaching staff is competent and has been working very hard to help him develop; so his story shouldn't turn into one like Joey Herrington's or Tim Couch's . As yet, though, this has been to no avail. The Lions defense totally undressed him.
It's still a bit early to draw the curtain on Tebow's pro football career. But unless he starts improving quickly and dramatically, future comparisons will be to David Klingler, not Drew Breese.
H/T to LGM.
____________________________
The NFL is an extremely Republican-type organization. This is one of the less important reasons why.
Subscribe to:
Posts (Atom)
![[Most Recent Quotes from www.kitco.com]](http://www.kitconet.com/charts/metals/gold/tny_au_xx_usoz_4.gif)


I am one who so objects, and I certainly haven’t missed it.
http://jazzbumpa.blogspot.com/2011/06/labors-share.html
How can increasing corporate profits, per se, be inflationary? This just enables even greater wealth disparity. A falling labor share means most people get squeezed out of buying discretionary items. Hence, a continuing (and increasing?) aggregate demand shortfall,
I’d love to see a detailed explanation of how inflation can increase in this scenario.
BTW – put your graph on a log scale and you’ll see your CNCF/GDP ratio climbing during recessions, and very dramatically during this last one. Such was not usually the case before about
1970 (recession ca. 1955 is the exception.)
http://research.stlouisfed.org/fredgraph.png?g=3yb
Also, beware the denominator. Progressively lower GDP growth since ca. 1980 skews your ratio upward.
http://research.stlouisfed.org/fredgraph.png?g=3yd
JzB