Perhaps this is what is meant by "Creative Destruction."
Krugman on Weaponized Keynesianism.
Blog Post 1, 10/28.
Blog Post 2, 10/29.
Op Ed, 10/31.
BTW, this is how you can tell that somebody who cherry-picks an out-of-context quote to attack Krugman is bullshitting. When Krugman is serious about something, he beats the drum long, hard, and repeatedly.
OTOH, Krugman gets something horribly, terribly wrong in Blog Post 2, the Sandwichman avers, and I agree.
Link to Part 30.
Monday, October 31, 2011
Sunday, October 30, 2011
Quote of the Day
From Bill Mitchell:
I don't think I need to elaborate, even a little bit. At least not beyond what I've already said.
H/T to Art.
In the midst of the on-going debates about labour market deregulation, scrapping minimum wages, and the necessity of reforms to the taxation and welfare systems, the most salient, empirically robust fact of the last three or more decades – that actual GDP growth has rarely reached the rate required to maintain, let alone achieve, full employment – has been ignored.
I don't think I need to elaborate, even a little bit. At least not beyond what I've already said.
H/T to Art.
Saturday, October 29, 2011
Classic World Series Game Six
Commentators are going gaga over the "classic" nature of game six, with the Cards pair of comebacks from two down, and stirring 11th inning victory. I disagree. I've left this comment on two different blogs this evening, so rather than leave it stranded like any one of 41 game six bases-runners, I might as well bring it on home.
When they went to extra innings, I went to bed. It was after midnight in my time zone, and this was pretty much a who-gives-a-shit series for me, anyway. (Except that when Shrub threw out the first ball in Texas, I suddenly became an ad hoc Cardinals fan.) So - I'll take it on faith that the excitement of the final 2 innings + the bottom of the ninth had a hint of classic flavor.
OTOH, those original nine innings had nothing of the classic about them. What I saw was an embarrassing display of inept base running and inept fielding that garnished a perplexing melange of inept pitching and inept hitting, with a side of inconsistent umpiring.
In all seriousness, this was a lousy game, poorly executed in almost every way imaginable.
If my 9-year-old grandson's travel team played in a game with 5 errors and an astounding 41 Left on Base, I'd think it might be time for him to take up the trombone.
For this kind of display to take place in a world series is - in some deeply trivial way - a tragedy.
Tebow
I'm a pretty casual sports fan, so I really don't know a lot about Tim Tebow, other than that he wears his religiosity in a way that is more blatantly obvious then the horse on his hat. Not my style, to be sure, but I'm pretty much a live and let live kind of guy - so, it that's what floats his boat, more power to him.
Evidently, the come-from-behind 18-15 victory he pulled over the hapless 0-6 Dolpins, thus allowing the hapless Broncos to eke out their second win, has catapulted him to instant stardom. Cooler heads tend to be rather less impressed:
Nobody can reasonably claim that they didn't know what quantity they were getting with Tim Tebow. His games were lavishly reported in college, enough that anyone football savvy could run down his biggest liabilities going into the pro game:
Now, we find that mimicking Tebow's after-the-victory prayer stance has become "a stupid internet craze." This is kind of unfortunate, I think. The poor, persecuted Christian minority in this country already has more than enough crosses to bear. And I don't think anyone's religious beliefs should be ridiculed - at least, not much more than everyone's religious beliefs should be ridiculed. On the other hand, it takes some sort of high powered conceit to think that God is going to take a big and determinative interest in the outcome of an NFL game on any given Sunday, and more specifically that He/She/It will favor your team.
I guess the only reason I'm even thinking about this is that tomorrow the Bronco's play the Lions in Denver, and I'll get to see the game on TV. The Lions have a decent defense, and despite having cooled off from their torrid start, really should be able to beat the struggling Broncos, with or without Matthew Stafford at the helm..
If the above-quoted assessment is correct, then my feeling is that a team should defend against Tebow the way I think a team should defend against Denard Robinson. You know he can beat you with his feet. His ability to defeat you with his arm is quite a bit less certain. Take away his running game, and make him rely on the pass. It's where his game is the weakest.
Then we can see what his praying stance is after a loss.
Update 5:10 EST, Sunday, 9 min left in Q2: According to the Fox announcers, Gunther Cunningham agrees with me. Tebow now has 8 straight incompletions.
H/T's to the LW and Step-son Doug
Evidently, the come-from-behind 18-15 victory he pulled over the hapless 0-6 Dolpins, thus allowing the hapless Broncos to eke out their second win, has catapulted him to instant stardom. Cooler heads tend to be rather less impressed:
Nobody can reasonably claim that they didn't know what quantity they were getting with Tim Tebow. His games were lavishly reported in college, enough that anyone football savvy could run down his biggest liabilities going into the pro game:
• running speed that pro defenses could eat up far quicker than their college counterparts;All these problems were exposed last year and this Sunday, and none of them should give anyone pause. Yet despite Tebow's constancy, opinion-makers have see-sawed on him.
• a time-consuming, long throwing motion that seemed to vary every few tosses;
• poor accuracy;
• poor defensive reads, which led to his biggest shortcoming,
• over-dependence on the run.
Now, we find that mimicking Tebow's after-the-victory prayer stance has become "a stupid internet craze." This is kind of unfortunate, I think. The poor, persecuted Christian minority in this country already has more than enough crosses to bear. And I don't think anyone's religious beliefs should be ridiculed - at least, not much more than everyone's religious beliefs should be ridiculed. On the other hand, it takes some sort of high powered conceit to think that God is going to take a big and determinative interest in the outcome of an NFL game on any given Sunday, and more specifically that He/She/It will favor your team.
I guess the only reason I'm even thinking about this is that tomorrow the Bronco's play the Lions in Denver, and I'll get to see the game on TV. The Lions have a decent defense, and despite having cooled off from their torrid start, really should be able to beat the struggling Broncos, with or without Matthew Stafford at the helm..
If the above-quoted assessment is correct, then my feeling is that a team should defend against Tebow the way I think a team should defend against Denard Robinson. You know he can beat you with his feet. His ability to defeat you with his arm is quite a bit less certain. Take away his running game, and make him rely on the pass. It's where his game is the weakest.
Then we can see what his praying stance is after a loss.
Update 5:10 EST, Sunday, 9 min left in Q2: According to the Fox announcers, Gunther Cunningham agrees with me. Tebow now has 8 straight incompletions.
H/T's to the LW and Step-son Doug
Quote of the Day
I love it when Paul Krugman agrees with me.
I sometimes like to say that modern conservatism isn’t an attempt to turn the clock back to the Gilded Age, it’s an attempt to roll things back to before the Enlightenment, with all that godless talk about numbers and evidence and all that. Doesn’t sound that silly now, does it?
Never mind Darwin — let’s go after Newton!
As I put it on March 24th:
My tentative conclusion is that the Koch Bros. or their equivalents in any time or place, will do everything they can to amass as much as they can, at the expense of everyone else. Whether this involves slavery, serfdom, indentured servitude, or "I owe my soul to the company Sto'e" is an accident of local conditions. The post WW II era in America (and possibly Europe) is an aberration in history.
What you see now is a vigorous attempt to roll back not only the new deal, but early 20th century progressivism, the 13th Amendment, the rest of the constitution, and the enlightenment on which it is based.
They want to take us back to the 12th century. This is not hyperbole. I am deadly serious.
The ever polite and retrained Mr. P.K. does not go far enough, though he is directionally correct.
For more of my elaboration, see here.
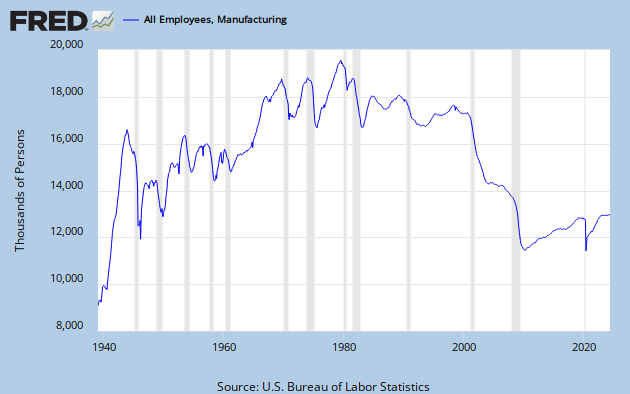
The Decline of Manufacturing
Art has been speculating on the trends in U.S. total manufacturing employment in the post WW II era.
The graph of the data can be seen in FRED series MANEMP.
Art's graph's with eyeballed trend lines are here and here. I suppose one can parse a curve like this in a number of ways. All the peaks and valleys tease the eye and complicate interpretation. Math to the rescue.
I suggested the correct techniques for determining trends:
The three regimes were by eyeball, not any technique. I should take my own advice. The following graphs will be busy. To see the simpler versions, click the FRED link or Art's links above. The first graph below includes an 8-Yr moving average (pink), an envelope 1 standard deviation above (red) and below (green) that average, an additional line (also green) starting in 1975 at 2 standard deviations below the average, and trend lines along the peaks and troughs.

Looks like three regimes to me. The first, with higher highs and higher lows runs from the beginning of the data set up to 1975 (bottoms) or 1979 (tops.). From then on, there is never again a higher high nor a higher low. The lows level off until 1993, and the highs collapse. After that point, the lows get much, much lower, and peaks cease to exist.
Three regimes: 1) robust, but erratic, growth through the 1973 peak, 2) stagnation into the 90's with level lows and declining highs, 3) collapse. The data points never go any higher than a full standard deviation BELOW the moving average - an almost inconceivable decline. Note that the shrinking standard deviation envelope in the 2nd regime is due exclusinely to the loss of recoveries, as troughs remain at a constant level: the Great Stagnation.
Next is YoY rate of change for the eight year average. Also included are 8, 13, and 18 year averages of RoC, and some trend lines on tops and bottoms. The beginnings of selected presidential administrations are also indicated.

Note that with the Reagan inauguration we have the first major peak that is lower than the preceding peak. With Clinton there is a kind of quasi-recovery - though the ultimate high in 2001 is less than the previous high in 1991, and only barely in positive territory. With Bush we witness what appears to be the onset of the death of manufacturing in America - a continuously negative rate of change for a complete decade.
Again, I see this as three regimes, the first two defined more by the tops than the bottoms: 1) level to increasing tops through 1970, 2) stagnation with declining tops through the end of the century, 3) utter collapse under Shrub.
Once again, this demonstrates the great stagnation - less and less manufacturing effort in the last three decades of the previous century. Now, in 2011, there are fewer people employed in manufacturing than there were in 1949.
This is the legacy of decades of Rethug rule.
The graph of the data can be seen in FRED series MANEMP.
Art's graph's with eyeballed trend lines are here and here. I suppose one can parse a curve like this in a number of ways. All the peaks and valleys tease the eye and complicate interpretation. Math to the rescue.
I suggested the correct techniques for determining trends:
The correct way to construct trend lines is across the troughs if the trend is upward, and across peaks if the trend is downward. Each line, so constructed, points clearly to the time ca 1974-1980.
Alternatively, take a fairly long average (to smooth the variations) and look for rate of change in the average. Or wrap a +/- 1 standard deviation envelope around the average and see where the original data points fall in that envelope.
I see three regimes:
1) up to 1974/80 increasing
2) thence to 1999/2000 decreasing slowly
3) the Shrubian collapse
The three regimes were by eyeball, not any technique. I should take my own advice. The following graphs will be busy. To see the simpler versions, click the FRED link or Art's links above. The first graph below includes an 8-Yr moving average (pink), an envelope 1 standard deviation above (red) and below (green) that average, an additional line (also green) starting in 1975 at 2 standard deviations below the average, and trend lines along the peaks and troughs.
Total U.S. manufacturing employment

Looks like three regimes to me. The first, with higher highs and higher lows runs from the beginning of the data set up to 1975 (bottoms) or 1979 (tops.). From then on, there is never again a higher high nor a higher low. The lows level off until 1993, and the highs collapse. After that point, the lows get much, much lower, and peaks cease to exist.
Three regimes: 1) robust, but erratic, growth through the 1973 peak, 2) stagnation into the 90's with level lows and declining highs, 3) collapse. The data points never go any higher than a full standard deviation BELOW the moving average - an almost inconceivable decline. Note that the shrinking standard deviation envelope in the 2nd regime is due exclusinely to the loss of recoveries, as troughs remain at a constant level: the Great Stagnation.
Next is YoY rate of change for the eight year average. Also included are 8, 13, and 18 year averages of RoC, and some trend lines on tops and bottoms. The beginnings of selected presidential administrations are also indicated.
Manufacturing employment - smoothed YoY RoC

Note that with the Reagan inauguration we have the first major peak that is lower than the preceding peak. With Clinton there is a kind of quasi-recovery - though the ultimate high in 2001 is less than the previous high in 1991, and only barely in positive territory. With Bush we witness what appears to be the onset of the death of manufacturing in America - a continuously negative rate of change for a complete decade.
Again, I see this as three regimes, the first two defined more by the tops than the bottoms: 1) level to increasing tops through 1970, 2) stagnation with declining tops through the end of the century, 3) utter collapse under Shrub.
Once again, this demonstrates the great stagnation - less and less manufacturing effort in the last three decades of the previous century. Now, in 2011, there are fewer people employed in manufacturing than there were in 1949.
This is the legacy of decades of Rethug rule.
Thursday, October 27, 2011
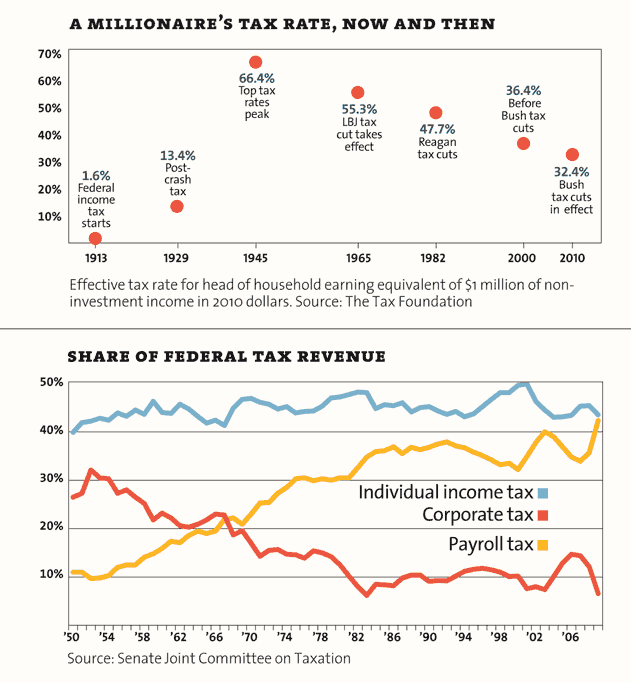
Plutocracy Now
Just discovered this post at Mother Jones, and borrowed their title. The post has a series of graphs demonstrating the enormous wealth inequality in this country, and how the super-wealthy have confiscated the vast majority of all national wealth generated over the past few decades.
The one showing Share of Federal Tax Revenues almost looks as if it were lifted directly from a post at this blog from February - even the color scheme is the same. Well, it's not quite identical- theirs has a shorter time span. But it sure caught my eye.
Anyway, you should go check it out. If you've been paying attention, you won't be surprised.
H/T to Randi Rhodes.
Quotes of the Day
"He has put the goober in gubernatorial."
"When he says he can do for America what he's done for Texas, pay attention. That's no idle threat"
"If ignorance ever goes to $100 a barrel, you want to get the drilling rights to Perry's head."
--- Jim Hightower talking about Rick Perry, just moments ago on Rachel Maddow's program
"When he says he can do for America what he's done for Texas, pay attention. That's no idle threat"
"If ignorance ever goes to $100 a barrel, you want to get the drilling rights to Perry's head."
--- Jim Hightower talking about Rick Perry, just moments ago on Rachel Maddow's program
Friday, October 21, 2011
Thursday, October 20, 2011
Held in Reserve
Art points out what has happened to all the QE money.
It is in excess reserves. Not exactly every last penny, but the great vast majority.
His comment to graph #3 at his link: "Base money less excess reserves shows a gradual uptrend. Almost like normal growth." This got me wondering what normal growth actually is. The graph below illustrates YoY % growth in {base money - excess reserves} (FRED series AMBSL - series EXCRESNS)
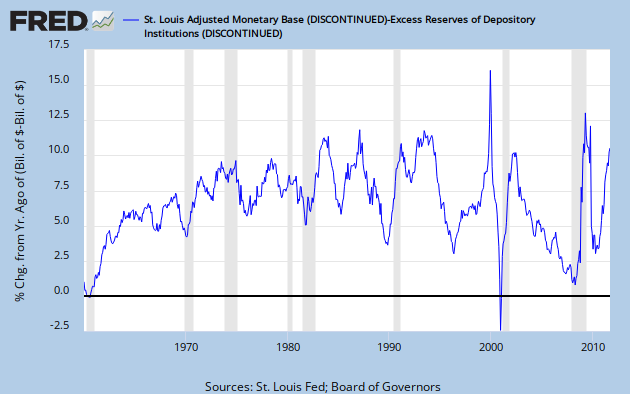
First observation: The growth number varies a lot, but is between 5 and 10% most of the time since the mid 60's.
Second observation: Without prior knowledge, there is absolutely no way to detect any QE event on this graph - exactly to Art's point.
Third observation: The rate of change always increases during a recession, from the very minor uptick in 1974 to the quite dramatic upticks of 2001 and 2009. But there's also a big, narrow spike in the late 90's, and significant bumps in the mid 80's and early 90's - all non-recessionary times.
Fourth observation: The rate of change increased steadily from zero to about 6% during the 60's. Since then it looks like about a 7.5% average, BUT - with an increasing standard deviation.
I don't know what to make of this history, but the clear message of more recent events is that the apparent big cash infusions of QE (see Art's graph #1) were no infusions at all. The net result is that banks, by drawing a small but real return on excess reserves have further enriched themselves while doing no good at all to the economy at large. This is just one more - and very subtle - form of rentier activity.
Bottom line: We are so screwed.
Update: Just for Kicks, here are the monetary base and the monetary base less excess reserves for the period 1960 through the end of 2007. Both lines are plotted, but they overlap completely.
Now, here they are for 1/1/2008 on. Not so much overlap now.
Update 2: In comments, Nanute says: "Does it not seem that all the QE money has had the perverse effect of slowing down the velocity of money? By paying interest on excess reserves the Fed is basically allowing banks to profit from borrowing from the government. It's like free money."
Indeed. A look at this FRED graph (normalized to 100 at 1/1/2005) shows how velocity for all the money measures has tanked since 2008. From Art's earlier post, QE initiation dates are Sept. '08 and Nov. '10. In fairness, we have to note that velocity for M1 and M2 had been sliding since early '06. Not so for MZM, though, which rose steadily until late in 2007.
It is in excess reserves. Not exactly every last penny, but the great vast majority.
His comment to graph #3 at his link: "Base money less excess reserves shows a gradual uptrend. Almost like normal growth." This got me wondering what normal growth actually is. The graph below illustrates YoY % growth in {base money - excess reserves} (FRED series AMBSL - series EXCRESNS)
First observation: The growth number varies a lot, but is between 5 and 10% most of the time since the mid 60's.
Second observation: Without prior knowledge, there is absolutely no way to detect any QE event on this graph - exactly to Art's point.
Third observation: The rate of change always increases during a recession, from the very minor uptick in 1974 to the quite dramatic upticks of 2001 and 2009. But there's also a big, narrow spike in the late 90's, and significant bumps in the mid 80's and early 90's - all non-recessionary times.
Fourth observation: The rate of change increased steadily from zero to about 6% during the 60's. Since then it looks like about a 7.5% average, BUT - with an increasing standard deviation.
I don't know what to make of this history, but the clear message of more recent events is that the apparent big cash infusions of QE (see Art's graph #1) were no infusions at all. The net result is that banks, by drawing a small but real return on excess reserves have further enriched themselves while doing no good at all to the economy at large. This is just one more - and very subtle - form of rentier activity.
Bottom line: We are so screwed.
Update: Just for Kicks, here are the monetary base and the monetary base less excess reserves for the period 1960 through the end of 2007. Both lines are plotted, but they overlap completely.
Now, here they are for 1/1/2008 on. Not so much overlap now.
Update 2: In comments, Nanute says: "Does it not seem that all the QE money has had the perverse effect of slowing down the velocity of money? By paying interest on excess reserves the Fed is basically allowing banks to profit from borrowing from the government. It's like free money."
Indeed. A look at this FRED graph (normalized to 100 at 1/1/2005) shows how velocity for all the money measures has tanked since 2008. From Art's earlier post, QE initiation dates are Sept. '08 and Nov. '10. In fairness, we have to note that velocity for M1 and M2 had been sliding since early '06. Not so for MZM, though, which rose steadily until late in 2007.
Correlation isn't causation, but we can safely say that two rounds of QE did nothing to increase money velocity, for any money measure.
Friday, October 14, 2011
What the Hell?!? Friday - Things You Really Gotta Have (Or Maybe Not) Edition
Beer mugs, pi, swimwear, chair leg socks, games, toys, travel, magnetism, demented fairy art work (?) eviler cupcakes, and a few touches of Eeewww!!!
Thursday, October 13, 2011
Quote of the Day - Lizard Attacks
A potential source for Herman Cain's 9-9-9 tax plan.
The beauty of Cain's plan is that it is yet another conservatard ploy to transfer the burden of taxation from the wealthy to the poor. You do realize, I hope, that between 20 and 40 % of the population pay no Federal Income tax, because they do not make enough to qualify as taxpayers. In the middle quintile, the effective rate is only around 3%. The Cain ploy hits the poor with the double wammy of AT LEAST tripling their Federal income tax, while also substantially increasing their sales tax, and giving huge ADDITIONAL tax advantages to to the rich. And the more you make, the bigger the advantage. It's freaquing BRILLIANT.
Best of all, it illustrates that Cain's plan - which is fine in an imaginary world where you need to worry about lizards - would make us all have fun thwarting the attacks of lizard people.
"We encourage politicians to continue to look to innovative games like SimCity for inspiration for social and economic change," said Katsarelis. "While we at Maxis and Electronic Arts do not endorse any political candidates or their platforms, it's interesting to see GOP candidate Herman Cain propose a simplified tax system like one we designed for the video game SimCity 4."Adopting such a simple tax structure, Katsarelis said, would allow fantasy political leaders to focus their energy on infrastructure and national security. "Our game design team thought that an easy to understand taxation system would allow players to focus on building their cities and have fun thwarting giant lizard attacks, rather than be buried by overly complex financial systems."
The beauty of Cain's plan is that it is yet another conservatard ploy to transfer the burden of taxation from the wealthy to the poor. You do realize, I hope, that between 20 and 40 % of the population pay no Federal Income tax, because they do not make enough to qualify as taxpayers. In the middle quintile, the effective rate is only around 3%. The Cain ploy hits the poor with the double wammy of AT LEAST tripling their Federal income tax, while also substantially increasing their sales tax, and giving huge ADDITIONAL tax advantages to to the rich. And the more you make, the bigger the advantage. It's freaquing BRILLIANT.
Best of all, it illustrates that Cain's plan - which is fine in an imaginary world where you need to worry about lizards - would make us all have fun thwarting the attacks of lizard people.
Thursday Market Action
My Stock Market Musings have been moved to a new blog, Amateur Elliott.
Please continue reading over there. Assuming you've been reading here . . .
Please continue reading over there. Assuming you've been reading here . . .
Wednesday, October 12, 2011
Wednesday Market Action
After yesterday's futile attempts, the SP500 burst through 1200 today with an opening gap up. It topped out at 1220.25, which is pretty darn close to 1223, the 50% retracement of the drop from the May 2nd top.
There was a late afternoon drop-off to the 1207.25 close. That's about it for now.
.
There was a late afternoon drop-off to the 1207.25 close. That's about it for now.
.
Crackers
Over at The Corner last night, one of Jerome's brilliant anagrams brought on some discussion of the word "Cracker" as it pertains to certain poor, rural southern White Americans. It flowed over into today's discussion when the word "cracker" appeared in today's LA Times crossword as part of clue 11A. Ant shared a link to a timely Arizona Republic article in which the word "cracker" again appears, used this time as a specific pejorative.
I was pondering this overnight, and I think the article reinforces my conclusion. Help me out if I've got this wrong, but I think "Cracker" is pretty lame, as pejoratives go. Further, it is not racist in the same sense as the word used in the name of a certain Texas hunting ranch.
And this is why: words like "Nigger," "Spic," "Chink," etc. are used promiscuously to denigrate any and all members of whatever ethnic group one chooses to revile. These are collectives that do not readily admit exceptions in the minds and hearts of those who use them. "Cracker" does not fit that mold. Though being white is a necessary qualifier to be a "Cracker," it is not the defining characteristic.
From my Midwestern perspective, I can't say for sure exactly what the characteristics of crackerhood are, but I can take some guesses. To whit: a "Cracker" is clannish, prejudiced, xenophobic, ignorant, and - above all - racist. The fact that he is also white is a trivial detail.
I think the Arizona Republic article linked above illustrates this pretty effectively. Carlos Gross, an African-American man was insulted by an unidentified white man's use of an unidentified racial epithet. Gross called the other man a "cracker" and beat him with a baseball bat. Gross was wounded by the unidentified word. The other guy was wounded by a physical assault. Evidently, "cracker," which the A.R. had no problem printing, didn't come close to evening the score.
The main point, though, is that the guy who was physically injured earned his badge of crackerhood, not by being white, but by being ignorant and racist.
I shouldn't have to point this out, but it's probably necessary. I am not equating an insult with physical harm, and I am not condoning Gross's assault of the other guy. Gross did a lot of things wrong here. His underlying problem was taking the other guy's comment to heart. If you let somebody affect your behavior with an insult, you are giving that unworthy person undeserved and unnecessary control over some facet of your life.
.
Tuesday, October 11, 2011
Tuesday Market Action
The SP500 made 4 or 5 attempts to hit 1200 today, and never quite got there, topping at 1199.24 in the morning before closing at 1195.54. Sometimes you have to take a step back and look at the bigger picture, though. Now it appears that the current bounce is correcting the entire drop from May 2. This means my estimate of a bottom between 1000 and 1050 missed the mark. The October 4 bottom was 1074.77.
Looking at retracement targets, the .382 level at 1188 has already been passed. The .5 level is at 1223. That looks like the next likely potential top.
Looking at retracement targets, the .382 level at 1188 has already been passed. The .5 level is at 1223. That looks like the next likely potential top.
Monday, October 10, 2011
Monday Market Action
Well, this is trying. An already apparently steep retracement has now advanced even further. The SP500 intraday high today of 1191.35 is a little more than 4 points below the 9/27 high of 1195.86, so it's still possible that the drop from there is what is being corrected. There are other possibilities as well, of course.
This will be a very busy week for me, so analysis might be sketchy, and charts will be catch as catch can. Just as well since I'm rather baffled at the moment. Still, you're getting your money's worth here - right?
We'll see if there's anything more to add after the close. Probably not, though.
UPDATE: The index took a jump up to 1194.91 at the end of the day. Beats me.
.
Friday, October 7, 2011
Friday Market Action
The SP500 broke out of a trading channel that contained it quite neatly from Wednesday until this morning. The peak this morning was at 1171.40, within a fraction of the .618 retracement of the drop from 8/31 at 1171.14. This occurred against steeply dropping momentum - as you would expect from a day and a half of sideways motion.

The next leg down might be starting, though the time proportion seems awkwardly short. It's too late to give this any deeper thought, and next week should clarify the picture.
UPDATE: I would like this to be a correction of the drop from Tuesday, Sept.27. But, if so, it passed the .768 level at 1169.96 by a couple of points. This is extremely steep for a retracement, but not impossible.
The market is not well known for doing what I'd like. But if it does, then my prediction of an intrmediate bottom in the 1000-1050 range is still a possibility.
Thursday, October 6, 2011
Does Debt Cause Inflation?
Art certainly thinks so.
If this is the case, then we should see a definite and specific correlation that is robust over time. The absence of correlation is straight-forward refutation of any claim of causation. To give a first look, I went to FRED and constructed a graph of YoY % change for two series: CMDEBT (Household Credit Market Debt Outstanding ) and CPIAUCSL (Consumer Price Index for All Urban Consumers.)

My reasoning is that if debt drives inflation, then the curves should move in some sort of similar pattern. We see this happening during a specific period. From the late 60's through about 1980, big increases in debt do lead to proportionally large increases in inflation. This period is highlighted by the red oval. But that is only one decade out of six. The rest of the time we find a great deal of contrary motion. I've thrown some red arrows on the graph to show this effect.
The period from 1990 to the current economic malaise is especially striking: a broad advance in debt spanning almost two decades while inflation wiggled quite a bit, but went absolutely nowhere.
Maybe this isn't the right way to look at it. I'm certainly willing to consider other evidence. But as of now, I'll say two things. First, the 70's were really different with regard to inflation - as I've indicated before with another potential inflation cause. Second, the idea that debt causes inflation, barring some other strong evidence to the contrary, is D.O.A.
.
However, the U.S. dollar has fallen much in value since the end of World War Two. And all that time, the quantity of money in circulation was being suppressed. And all that time it was credit-use that added to the demand that was causing inflation. And all the while, the cost of using credit was creating additional upward pressure on prices. It was not printing money that caused inflation. The use of credit caused inflation.
If this is the case, then we should see a definite and specific correlation that is robust over time. The absence of correlation is straight-forward refutation of any claim of causation. To give a first look, I went to FRED and constructed a graph of YoY % change for two series: CMDEBT (Household Credit Market Debt Outstanding ) and CPIAUCSL (Consumer Price Index for All Urban Consumers.)

My reasoning is that if debt drives inflation, then the curves should move in some sort of similar pattern. We see this happening during a specific period. From the late 60's through about 1980, big increases in debt do lead to proportionally large increases in inflation. This period is highlighted by the red oval. But that is only one decade out of six. The rest of the time we find a great deal of contrary motion. I've thrown some red arrows on the graph to show this effect.
The period from 1990 to the current economic malaise is especially striking: a broad advance in debt spanning almost two decades while inflation wiggled quite a bit, but went absolutely nowhere.
Maybe this isn't the right way to look at it. I'm certainly willing to consider other evidence. But as of now, I'll say two things. First, the 70's were really different with regard to inflation - as I've indicated before with another potential inflation cause. Second, the idea that debt causes inflation, barring some other strong evidence to the contrary, is D.O.A.
.
Thursday Market Action
The SP500 peaked at 1165.55 late in the session and closed marginally lower at 1164. 97, for a gain of 1.83%. Moves well above 1% are commonplace these days. The gain came against declining momentum, which is now close to zero.
Obviously the correction continues, but it looks pretty tired at this point.
Not much to add until the decline resumes.
.
Obviously the correction continues, but it looks pretty tired at this point.
Not much to add until the decline resumes.
.
So Why Are the Tigers in Game 5?
The two victories are by scores of 5-3 and 5-4; the losses by scores of 9-3 and 10-1, so you might think I'm asking that question the wrong way around. But, really this has at least as much to do with Tiger failures as with Yankee success. First notable item is their inability to hit the eminently hittable A.J. Burnett. Sure Curtis Granderson saved his bacon a couple of times, but that accounts for only two outs in a 9 inning game.
Here's the story. It's sad. The players who are supposed to provide the offensive punch haven't done it.

The midline players have done about as you might expect.

Note that Santiago's RBI count is only one behind Cabrera's. Ramon knocked Inge in twice in game 3, else there would be no game 5.
I'm not going to post stats for the hated Yankees. But I will note most of their guys are doing what is expected - except for Jorge Posada, who was on the bubble for making the post-season roster. He's hitting .400, has 4 walks to go with his 4 hits, and has scored 4 times.
We shouldn't have to rely on Delmon Young hitting the occasional HR. For the Tigers to win tonight, Cabrera has to put on his MVP shoes, and Martinez, Jackson and Avila need to show up with bats in their hands. And Fister has to be Fister, not that imposter we saw on Saturday.
According to The Detroit Sports Site, Mags is in Right tonight, and Don Kelly will start at 3rd Base. Betamit has worked himself out of the line up. Kelly would be 4 for 7, but one of Granderson's Burnett-bacon-savers came from Kelly's bat.
.
Here's the story. It's sad. The players who are supposed to provide the offensive punch haven't done it.
The midline players have done about as you might expect.
Those part-time playing Twinkiesque back-of-the-roster guys have mostly overachieved, but they can't carry the team.

Note that Santiago's RBI count is only one behind Cabrera's. Ramon knocked Inge in twice in game 3, else there would be no game 5.
I'm not going to post stats for the hated Yankees. But I will note most of their guys are doing what is expected - except for Jorge Posada, who was on the bubble for making the post-season roster. He's hitting .400, has 4 walks to go with his 4 hits, and has scored 4 times.
We shouldn't have to rely on Delmon Young hitting the occasional HR. For the Tigers to win tonight, Cabrera has to put on his MVP shoes, and Martinez, Jackson and Avila need to show up with bats in their hands. And Fister has to be Fister, not that imposter we saw on Saturday.
According to The Detroit Sports Site, Mags is in Right tonight, and Don Kelly will start at 3rd Base. Betamit has worked himself out of the line up. Kelly would be 4 for 7, but one of Granderson's Burnett-bacon-savers came from Kelly's bat.
.
Wednesday, October 5, 2011
A Different Look at Real GDP
Over at Asymptosis, Steve presents a graph of the annual change in average GDP growth for 5-Yr rolling periods. Have a look.
He points out that the differing inflation regimes had a profound influence on the shape of the curve - which they do. But even with inflation out of the picture, there is still a regime change, and it still happens in the early 80's. To take away the inflation effect, I've made what I hope is a similar graph. The GDP change line is color coded by President's Party, Blue for Dems and Red for Rethugs.
I've also included a 13 year average line in yellow, to smooth out the long term trend. This clearly shows the two regimes, and when the change occurred. Here, in a nutshell, is the Great Stagnation, brought to you by Reagan, Bush and Shrub. I'm not a big Bill Clinton fan, but that dismal competition makes him look awfully good.

I'm not sure I used the same methodology as Steve. I went to FRED, downloaded series GDPC96: Real GDP, quarterly data. I then 1) took a five year (20 Q) average of the data, and 2) computed a percentage change from 4 quarters earlier for that average, for each quarter, starting in Q1 1952. This percentage change is plotted as the red/blue line. The yellow line is simply a 13 year (52 Q) average of that rate of change. Note that with the exception of B. Hoover Obama, having a Dem Pres does pretty wonderful things for GDP growth. In contrast, having a Rethug Pres means taking giant steps toward economic stagnation. I hope you knew that.
From 1970 through Q1 1981, the 13-Yr. average hovers between4.8 and 4.9% 3.8 and 3.9%. By the end of 1984, the average dropped to 3.04%. It never goes above 3.15% again until 1999 - very late in the Clinton administration. Remember - this is a 13 year average, and by the middle of '02, it had already passed its late peak value of 3.43%. From the middle of '05 to about the middle of '09 it hovered around 3.05%. The effect of the great recession has been a slow decline to 2.78% for the most recent data point in Q2 '11.
Note also that the two big drops are at the starts of the Reagan and Shrub administrations. This is hardly a coincidence.
.
He points out that the differing inflation regimes had a profound influence on the shape of the curve - which they do. But even with inflation out of the picture, there is still a regime change, and it still happens in the early 80's. To take away the inflation effect, I've made what I hope is a similar graph. The GDP change line is color coded by President's Party, Blue for Dems and Red for Rethugs.
I've also included a 13 year average line in yellow, to smooth out the long term trend. This clearly shows the two regimes, and when the change occurred. Here, in a nutshell, is the Great Stagnation, brought to you by Reagan, Bush and Shrub. I'm not a big Bill Clinton fan, but that dismal competition makes him look awfully good.

I'm not sure I used the same methodology as Steve. I went to FRED, downloaded series GDPC96: Real GDP, quarterly data. I then 1) took a five year (20 Q) average of the data, and 2) computed a percentage change from 4 quarters earlier for that average, for each quarter, starting in Q1 1952. This percentage change is plotted as the red/blue line. The yellow line is simply a 13 year (52 Q) average of that rate of change. Note that with the exception of B. Hoover Obama, having a Dem Pres does pretty wonderful things for GDP growth. In contrast, having a Rethug Pres means taking giant steps toward economic stagnation. I hope you knew that.
From 1970 through Q1 1981, the 13-Yr. average hovers between
Note also that the two big drops are at the starts of the Reagan and Shrub administrations. This is hardly a coincidence.
.
Wednesday Market Action
Things move quickly from easy to difficult. The SP500 is in a corrective wave, and they are hard to read. At this point I'm not sure how much of the decline is being corrected. My wave count from Monday looks OK, but does not stack up well with what has happened since.
If this is a correction of the drop from the 9/29 close, as I was expecting, than it is an extremely deep retracement, covering more than .786 of the drop. Not impossible, I suppose, but a very awkward and unlikely outcome.
If the correction is from the early morning high of 9/29, then today's high of 1146.07 is only a couple of points beyond the .666 retracement level at 1142.1. Should the advance not be finished, the next Fibonacci point would be .786 retracement at 1154.25.
If the correction is from the 8/31 high of 1230.71, then it has not reached the .50 retracement level at 1152.74.
The index made three or four attempts to pierce 1140 in the last couple of trading hours, and after finally succeeding, slipped a bit to close at 1144.03.
Today's advance came against weakening momentum and lower volume on the NYSE. Up volume was high, but not quite as high as yesterday's.
Hopefully, tomorrow's action will clear some of the mud from the water.
Tuesday, October 4, 2011
Tuesday Market Action
So much for being too easy. The gap down this morning took me by surprise. Evidently something was missing from my count, and one more down leg was needed to complete the pattern. This was a dynamic day, breaking out of the trend channel first on the low side, and then on the high side.
The drop from the close on Thursday at 1164 to today's low of 1074.77 is 85.63. Today's close at 1123.95 is about 6 1/2 points above the .50, and fewer than 4 points below the .618 retracement levels. There was a very sharp jump into the close today, covering about 35 points in 40 minutes. That can't go on very long, but probably has a little life left before the corrective wave is complete. A range of 1128 to 1132 might be a good target - approximately the .618 and .666 retracement levels.
.
Dale Coberly Explains Social Security
Dale does a great job of laying it all out - including why SS is sustainable, and what factors affect pay-in and pay-out rates.
The comment section is quite good, as well. The dumb comments generated meaningful responses.
.
The comment section is quite good, as well. The dumb comments generated meaningful responses.
.
Monday, October 3, 2011
Monday market Action
I wasn't going to take the time to post a chart today, but this was too easy. Wave 3 down is entering its late stages. Note the beautiful trading channel this move has defined - with no loss of momentum. It looks like wave iv has started. My target of 1000 to 1050 for the complete 5-wave pattern still holds. Today, wave 5 of iii traced out its own perfect five wave pattern. I'll leave labeling that move as an exercise for the interested reader. Go ahead, it's easy and fun.

Tomorrow ought to be up, retracing the drop from Thursday's close. Maybe 1140 will come into play - this time as resistance. Should be interesting.
Update: From the close Thursday at 1160.4 to today's low of 1098.92 is a drop of 61.48. A .666 retracement would take the bounce to 1139.87. Should be very interesting, indeed.
.
Subscribe to:
Posts (Atom)
![[Most Recent Quotes from www.kitco.com]](http://www.kitconet.com/charts/metals/gold/tny_au_xx_usoz_4.gif)

